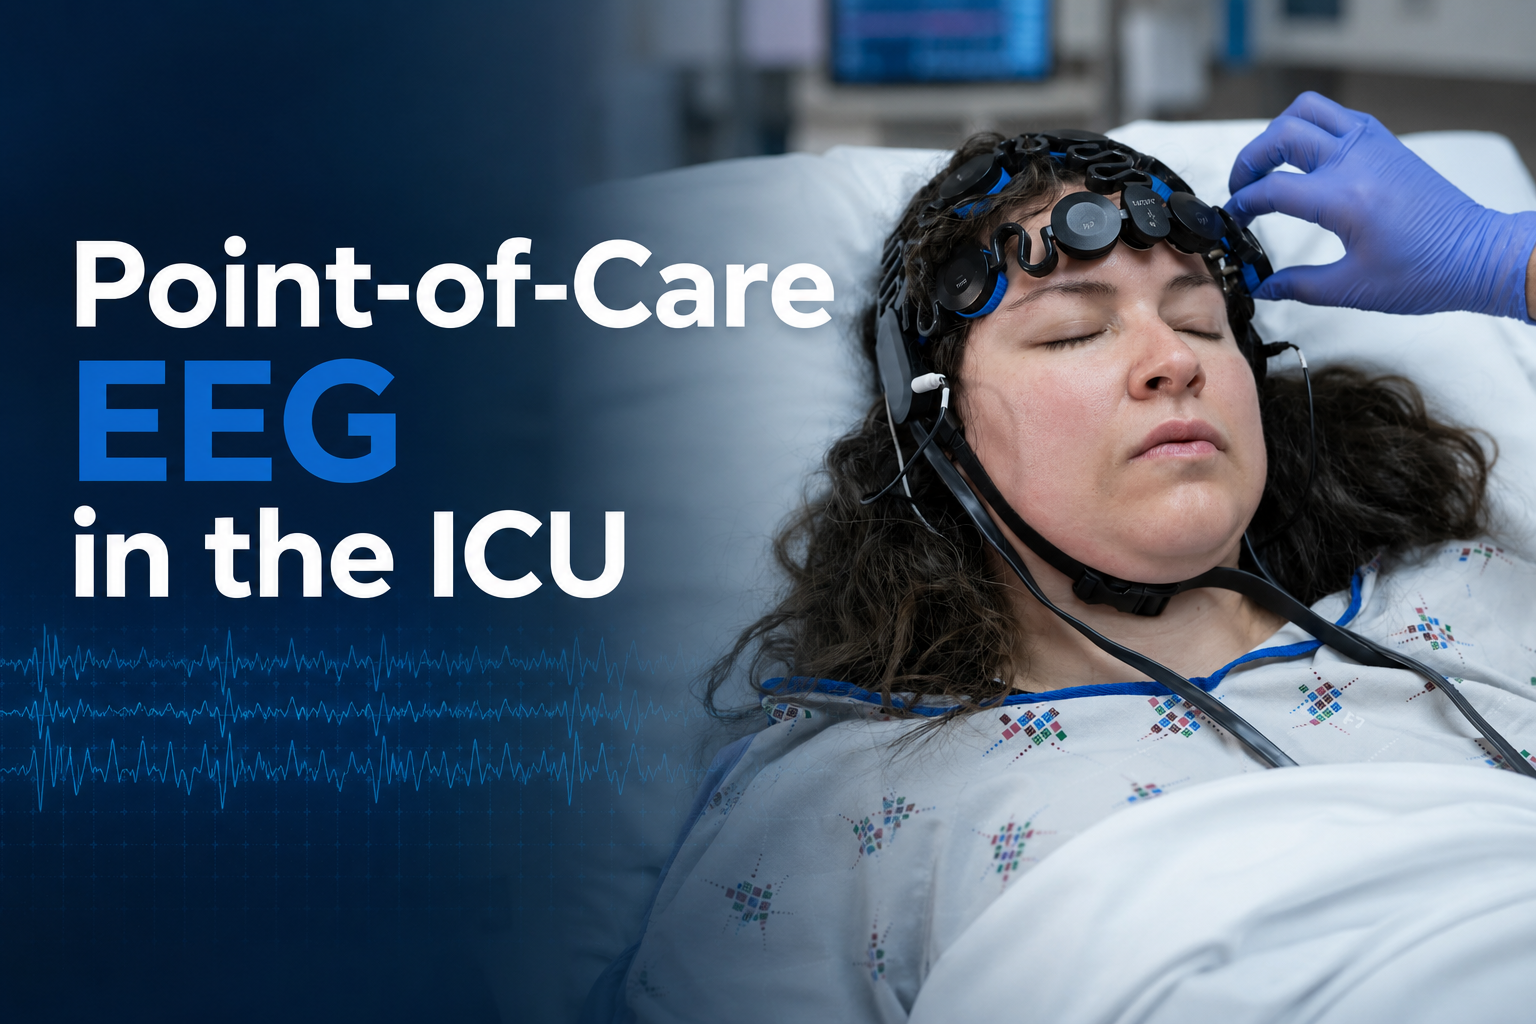
In emergency and critical care settings, clinicians need EEG solutions that can be deployed with both speed with clinical confidence. Zeto ONE EEG enables rapid, full-montage EEG acquisition with AI-enabled seizure detection NeuroPulse™, powered by encevis and NeuroNotis™ Report (delivered under a service agreement with Stratus), that combines automated analysis with rapid validation by registered EEG Technicians.
Importantly, AI-generated findings are intended to support, not replace, physician interpretation. Neurologist review remains essential for confirming findings, understanding clinical context, and guiding treatment decisions.
Why Hospitals Need More Than AI Seizure Detection
As hospitals look for faster ways to detect seizures, rapid point-of-care (POC) EEG systems are becoming more widely used. While AI can accelerate seizure detection, EEG interpretation still requires clinical expertise and patient-specific context. Neurologists play a critical role in distinguishing clinically meaningful findings and determining appropriate next steps in care.
This need for expert oversight remains essential even as AI tools become more sophisticated. In a recent interview with NeurologyLive, Armin Jewell, DO, neurologist and epilepsy specialist at Allina Health Brain and Spine Institute, emphasized that AI is a valuable aid but not a replacement for clinical judgment. As Dr. Jewell noted, algorithms can help identify potential seizure activity, but trained neurologists must still review EEG recordings and distinguish true seizures from artifacts before making diagnostic and treatment decisions.
“The AI is a tool that complements the neurologist rather than replacing them,” –
Armin Jewell, DO
What Is the NeuroNotis Report?
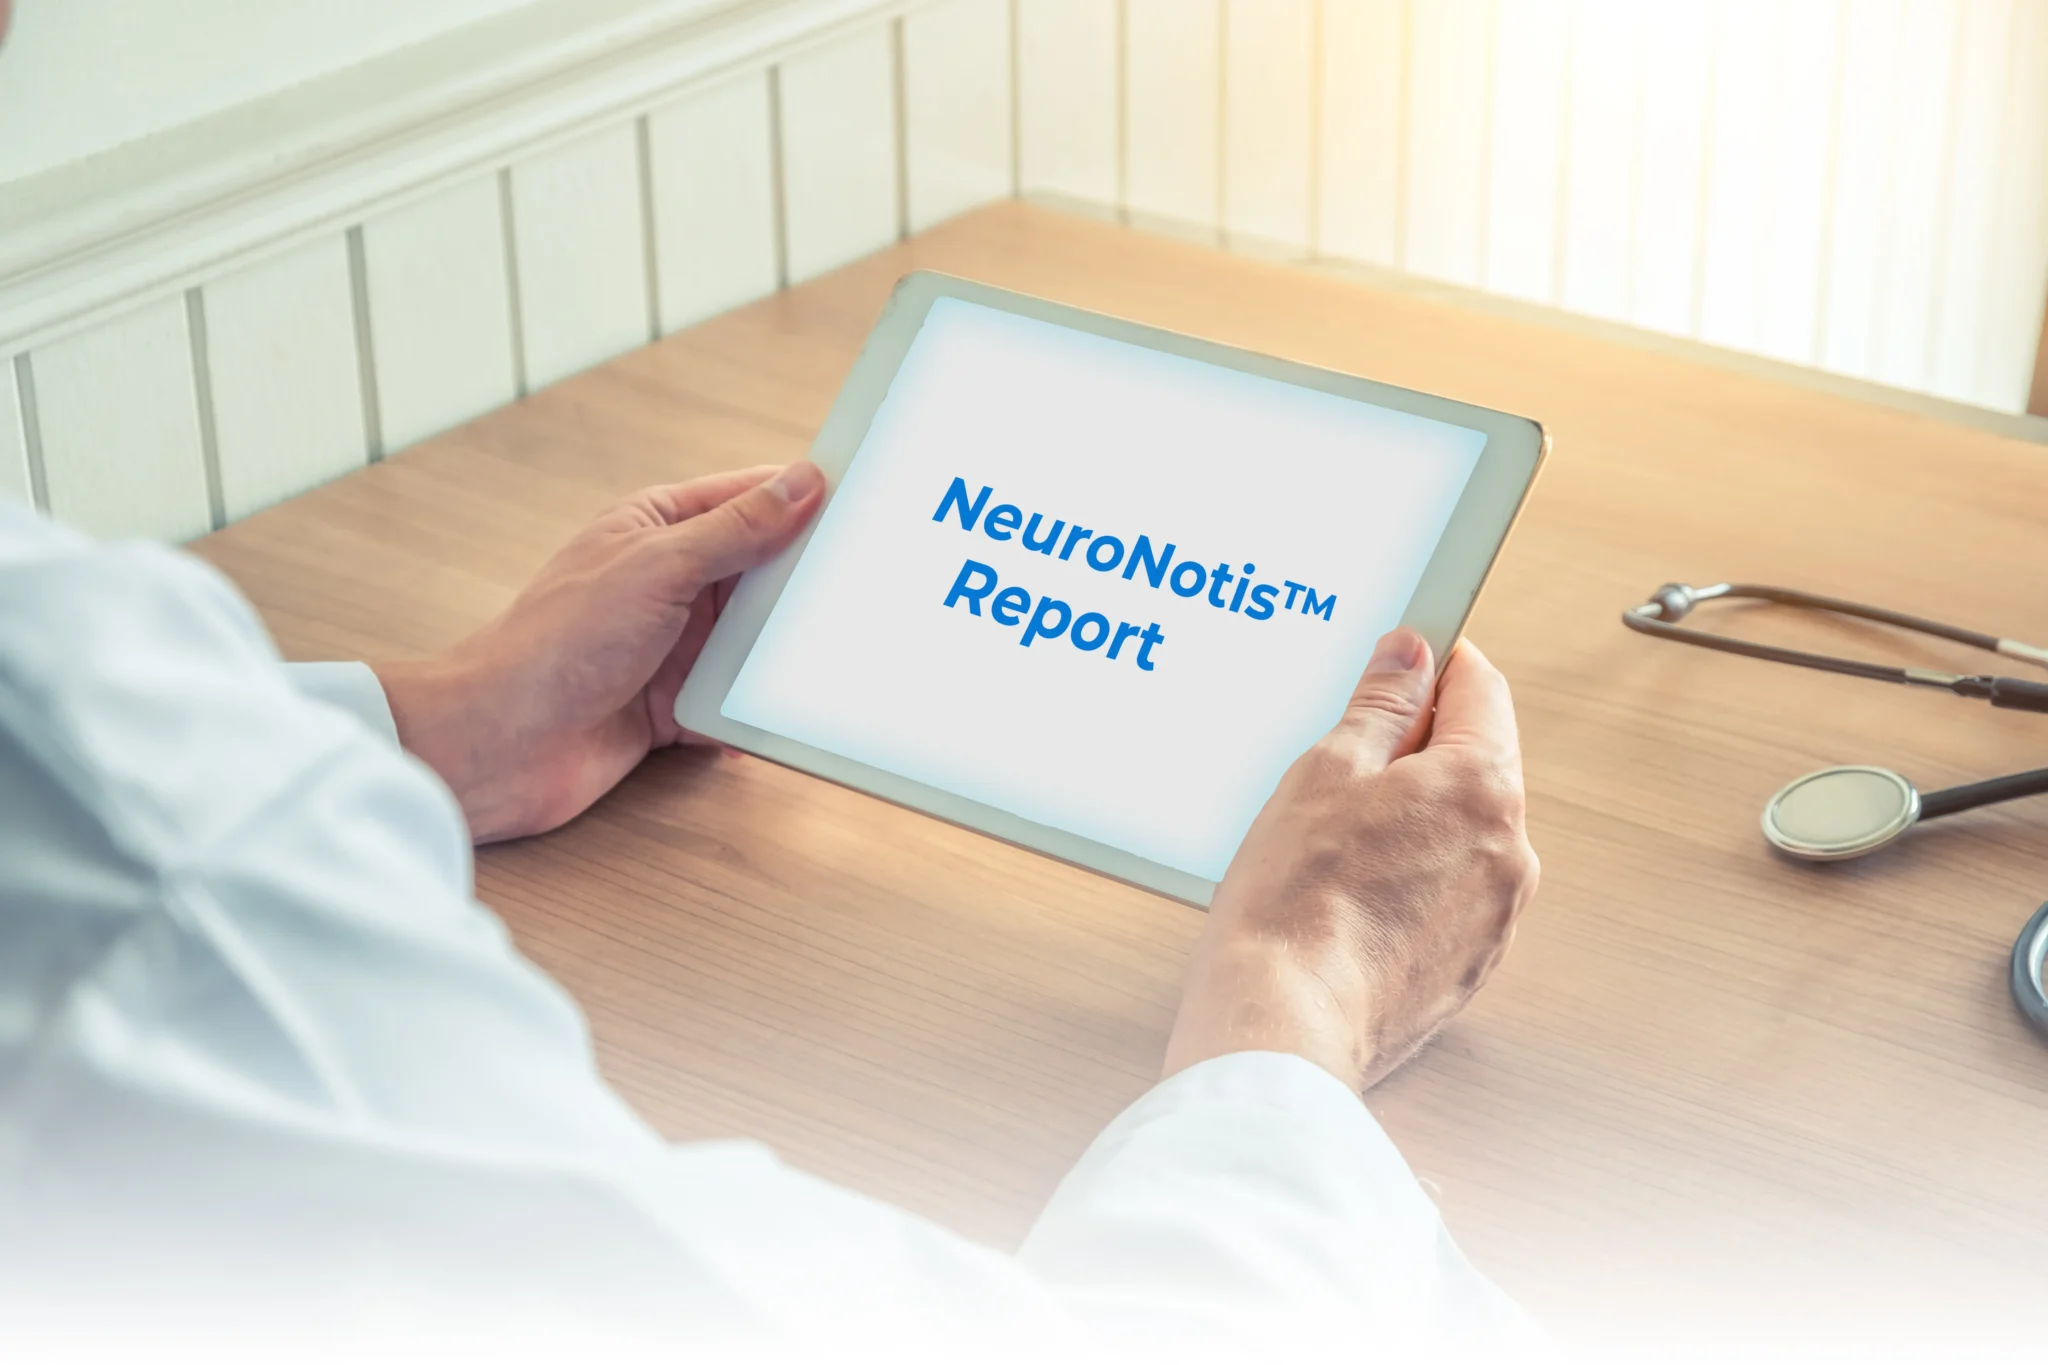
The NeuroNotis™ Report combines NeuroPulse AI seizure detection with rapid review by Registered EEG Techs from Stratus, helping care teams access validated EEG insights early in the EEG recording process.
The report is designed to provide neurologists and hospital teams with faster visibility into potential seizure activity while preserving physician oversight and interpretation.
Below is an illustrative example of a NeuroNotis report.
What Makes the Zeto EEG Different from Other Point-of-Care EEG Systems?
Zeto differentiates through the following key features:
Full montage, paste/gel-free EEG headset: Zeto is a full-montage EEG system with 21 electrodes placed according to the 10-20 system. Electrodes are paste-free, with no preparation, measurement, or cleanup required.
Video: High-resolution video built into the display unit.
AI + human validation: AI seizure detection findings are reviewed by Stratus registered EEG technologists through the NeuroNotis™ report, covering the critical first 75 minutes of recording.
Additional channels: Optional up to 8 auxiliary channels for EEG, EOG, ECG, or EMG could be added.
Continuous EEG recording (cEEG): 24+ hours
Improving Clinical Confidence in AI-enabled Seizure Detection
AI has improved how quickly clinicians can detect seizures, but EEG interpretation still depends on experienced clinical review. Neurologists remain essential for correlating EEG findings with the patient’s condition, history, and overall clinical picture.
This approach supports neurologists by providing:
Verified seizure burden analysis
Context for AI-generated results
Faster insights during critical care windows
By combining rapid EEG acquisition, AI-enabled analysis, technologist review, and neurologist interpretation, hospitals can move faster without compromising clinical confidence.
A Seamless EEG Solution for Hospitals
Zeto ONE is designed for rapid deployment in emergency and critical care settings, helping hospitals expand access to EEG without adding unnecessary workflow complexity.
Key advantages include:
Fast bedside EEG setup
Early visibility into potential seizure activity
Remote access to EEG data and review workflows
What Clinicians Are Saying
Clinicians highlight the benefit of combining AI-driven EEG insights with rapid human review in urgent care settings.
“By combining immediate AI-driven insights with near-instant human review, Zeto has created a model that should become standard in emergency-use settings. This approach is especially valuable in after-hours situations, where timely diagnosis may otherwise be delayed or require patient transfer. It’s a strong example of using the speed of AI together with experienced human judgment to support better clinical decision-making at the local level.” –Dr. Jamie Syrett, CMO of Auburn Community Hospital.
The Future of EEG: Smarter, Faster, Validated
The future of EEG lies in faster access to clinically meaningful information, achieved through the combination of AI-enabled analysis and expert clinical interpretation. Rather than replacing clinical judgment, these tools are increasingly working alongside it to support more confident and timely patient care decisions.
As Florian Strelzyk, CEO of Zeto, explains, “There is no longer a tradeoff between rapid EEG access and clinical confidence.”
Based on an educational webinar presented by Dr. Armin Jewell, Neurologist and Epileptologist from Allina Health in Minnesota, for the Neurocritical Care Society.
As point-of-care EEG (POC EEG) becomes increasingly integrated into emergency and critical care, clinicians are asking an important question: Where does this technology fit into modern neurologic practice?
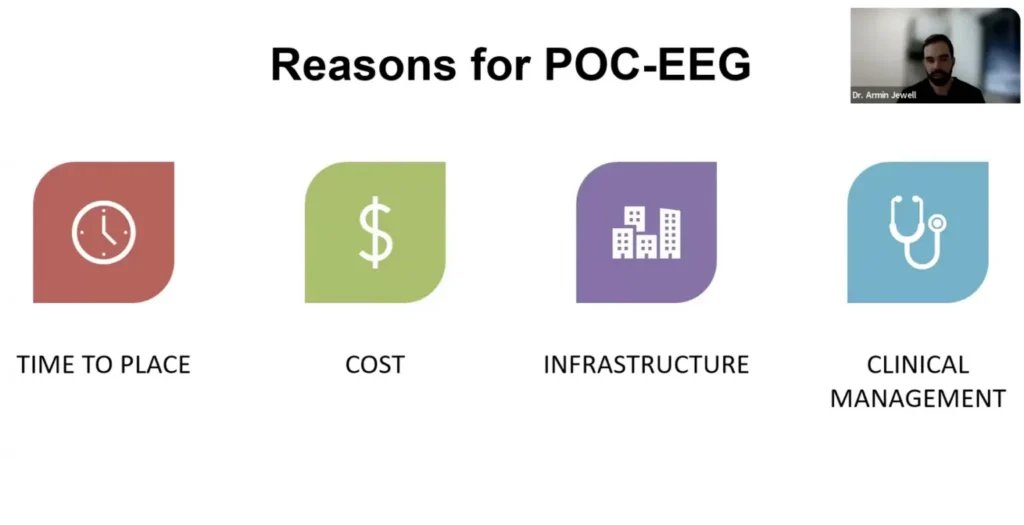
During a recent Neurocritical Care Society webinar,Dr. Armin Jewell, neurologist and epileptologist in Minneapolis, Minnesota, provided an evidence-based overview of point-of-care EEG, comparing it with conventional EEG while reviewing its clinical applications, current limitations, and future potential. From rapid seizure detection to emerging uses in stroke, traumatic brain injury, delirium, and post-cardiac arrest care, the webinar emphasized both the opportunities and the appropriate clinical role of this evolving technology.
What Is a Point-of-Care EEG?
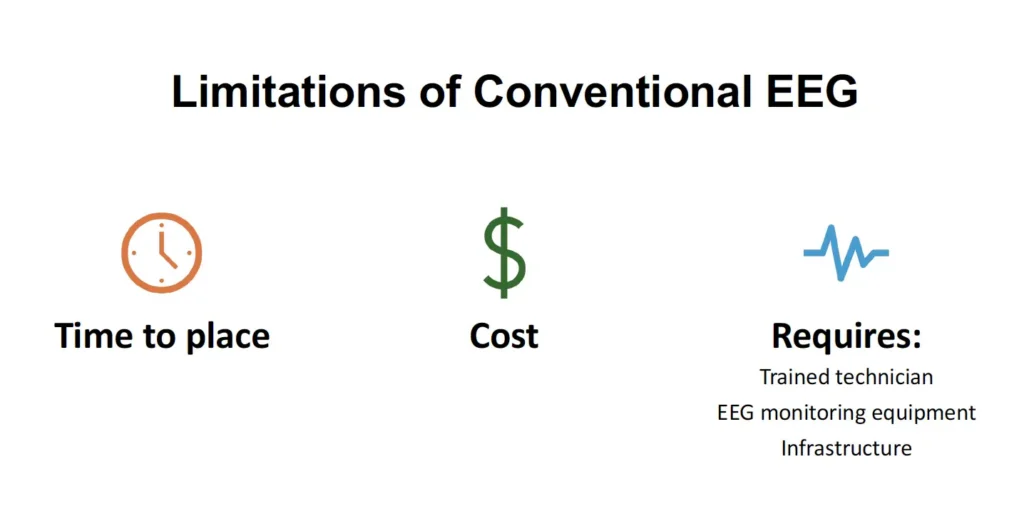
Point-of-care EEG (POC EEG) technology was developed to address the logistical, technical, and workflow limitations of conventional EEG in managing acute neurological conditions. While conventional EEG remains the gold standard for assessing brain activity, it requires a trained EEG technologist, specialized monitoring equipment, and hospital infrastructure – all of which can delay EEG acquisition when rapid clinical decisions are needed.
Introduced around 2018, point-of-care EEG systems typically use simplified and limited electrode arrays – usually disposable headbands or headsets designed for rapid bedside application – to capture clinically relevant EEG data within minutes. By simplifying deployment and eliminating the need for a dedicated EEG technologist for placement, POC EEG expands access to timely neurological monitoring in emergency departments, intensive care units (ICUs), and other acute care in both rural and urban settings.
Can be applied by any trained healthcare provider – no dedicated EEG technologist required
Rapid bedside setup
Disposable, single-use electrodes
AI seizure detection algorithm
One of the biggest workflow advantages highlighted by Dr. Jewell is that electrode placement no longer depends on an EEG technologist. After appropriate training, physicians, nurses, advanced practice providers, and other healthcare professionals can apply many point-of-care EEG systems, allowing monitoring to begin significantly sooner than traditional EEG workflows.
Different Types of Point-of-Care EEG Systems
Dr. Jewell emphasized that not all point-of-care EEG systems are the same. Current technologies range from simplified headband systems with a limited electrodes (8-12 channels) to full-head 19-channels headset that provide broader scalp coverage using a configuration similar to the traditional 10–20 system.
Both limited-montage and full-head POC EEG systems are designed to help clinicians evaluate patients with suspected seizures and support timely diagnosis. Limited-montage systems provide rapid assessment for seizure detection and triage, while full-head systems offer comprehensive brain coverage and are well suited for continuous monitoring and evaluation of a broader range of seizure types and focal abnormalities. Understanding these differences helps clinicians select the approach that best fits their patient population and clinical workflow.
Why Choose Point-of-Care EEG Over Conventional EEG?
“The goal is to provide the EEG information clinicians need to make earlier treatment decisions.”
Dr. Jewell highlighted several advantages of point-of-care EEG, particularly in time-sensitive neurological emergencies. Across multiple published studies, POC EEG consistently reduced the time required to initiate EEG monitoring compared with conventional EEGs, allowing clinicians to obtain critical neurological information much sooner.
Earlier monitoring may also translate into meaningful clinical and economic benefits. Studies reviewed during the webinar demonstrated reductions in interfacility patient transfers, shorter hospital and ICU stays, and overall cost savings. Dr. Jewell cited a cohort study by Ward et al., which estimated savings of approximately $14,000 per patient annually.
Perhaps most importantly, earlier EEG acquisition can directly influence patient management. As discussed during the webinar, rapid EEG significantly affected treatment decisions in patients with suspected nonconvulsive status epilepticus (NCSE) by helping clinicians start the treatment faster.
When to Use Point-of-Care EEG
Dr. Jewell reviewed several clinical scenarios where point-of-care EEG can provide meaningful value by supporting rapid neurological assessment and earlier clinical decision-making.
Suspected Nonconvulsive Status Epilepticus (NCSE)
One of the primary indications for point-of-care EEG is the rapid evaluation of patients with unexplained altered mental status and suspected NCSE. Dr. Jewell emphasized that POC EEG is particularly valuable for confirming ongoing seizure activity or helping exclude seizures as the cause of neurological deterioration.
Stroke
In patients presenting with acute stroke or stroke-like symptoms, point-of-care EEG can help determine whether seizure activity is contributing to altered mental status or neurological deficits, complementing – but not replacing – neuroimaging.
Traumatic Brain Injury (TBI)
Dr. Jewell reviewed emerging evidence supporting the use of point-of-care EEG in patients with traumatic brain injury. Rapid EEG may assist with early neurological assessment, seizure detection, prognostication, and even future prehospital applications.
Post–Cardiac Arrest
Continuous EEG plays an established role following cardiac arrest, and point-of-care EEG may provide valuable early neurological information.
Delirium
Emerging research suggests that EEG may help identify characteristic brain activity associated with ICU delirium. Dr. Jewell reviewed early studies evaluating point-of-care EEG and AI-assisted algorithms as potential tools for more objective delirium assessment.
Limitations of Point-of-Care EEG
Like any diagnostic technology, point-of-care EEG has important limitations that clinicians should understand.
Reduced Electrode Coverage
Many point-of-care EEG systems use a reduced electrode array rather than the full 10–20 International System used in conventional EEG. While this simplified design enables rapid bedside setup, it also captures electrical activity from fewer areas of the brain. As a result, certain seizure types—particularly brief, focal, low-burden, or parasagittal seizures—may not be detected. For this reason, a negative point-of-care EEG should not be interpreted as definitively ruling out seizure activity. When clinical suspicion remains high, conventional continuous EEG is still recommended for a more comprehensive evaluation.
AI Is a Screening Tool
AI-assisted seizure detection is a valuable feature of many point-of-care EEG systems, but it has important limitations. According to Dr. Jewell, current algorithms tend to favor detecting high overall seizure burden rather than isolated or brief seizure events. As a result, AI is best used as a screening tool that helps identify patients who may need urgent attention. Physician review remains essential to confirm the findings and ensure that subtle seizures or other clinically significant EEG abnormalities are not missed.
“AI is a clinical decision-support tool, but physician interpretation remains essential.”
False Positives and False Negatives
Motion artifact, muscle activity, poor electrode contact, and electrical interference can affect EEG recordings and occasionally result in inaccurate AI alerts. Dr. Jewell emphasized that automated findings should always be interpreted within the clinical context.
10 Key Takeaways from Dr. Jewell’s Presentation
Point-of-care EEG enables rapid detection of NCSE and high seizure burden.
It is best suited for detecting sustained or generalized seizure activity.
A negative point-of-care EEG does not rule out seizures.
It should be viewed as a triage tool and used to guide escalation to continuous EEG when appropriate.
AI-assisted seizure alerts are helpful but do not replace clinical interpretation.
Point-of-care EEG is especially valuable in community and resource-limited hospitals.
EEG artifacts are common and should always be recognized during interpretation.
Early EEG findings can meaningfully influence both the escalation and de-escalation of antiseizure therapy.
Point-of-care EEG can identify important EEG patterns beyond seizures, including burst suppression in selected patients.
Expert review remains essential when EEG findings are equivocal or clinical suspicion remains high.
Frequently Asked Questions About Point-of-Care EEG
What is point-of-care EEG?
Point-of-care EEG (POC EEG) is a rapid bedside brain monitoring technology developed to address the logistical, technical, and workflow limitations of conventional EEG in patients with acute neurological conditions. Designed for quick deployment, POC EEG enables clinicians to obtain clinically relevant EEG information within minutes, supporting earlier diagnosis and treatment decisions when time is critical. First POC EEG devices received FDA clearance in ~2018.
How is point-of-care EEG different from conventional EEG?
Point-of-care EEG is designed to prioritize speed, simplicity, and accessibility. Compared with conventional EEG, it offers several practical advantages:
Rapid setup at the bedside
Simple application
No dedicated EEG technologist required for electrode placement / setup
Typically uses a reduced electrode montage (although Zeto system offers full-head coverage)
Disposable electrode systems for streamlined workflow
While conventional EEG remains the gold standard for comprehensive brain monitoring, point-of-care EEG provides faster access to clinically relevant EEG data, making it a valuable tool for rapid assessment in emergency and critical care settings.
When should point-of-care EEG be used?
Dr. Jewell emphasized that point-of-care EEG is most valuable when rapid neurological assessment is needed. Common clinical scenarios include patients with unexplained altered mental status, suspected nonconvulsive status epilepticus (NCSE), stroke, traumatic brain injury, post–cardiac arrest, and cases of ICU delirium. It is particularly useful when conventional EEG is not immediately available or when clinicians need timely information to start treatment.
Does point-of-care EEG require an EEG technologist?
No. One of the defining features of point-of-care EEG is that it does not require a dedicated EEG technologist for electrode placement. After appropriate training, physicians, nurses, or other healthcare providers can apply the device, allowing EEG monitoring to begin much sooner than conventional workflows often permit.
What are the limitations of point-of-care EEG?
Although point-of-care EEG provides valuable clinical information, it has important limitations. Depending on the system, reduced electrode coverage may be a big limiting factor.
Motion artifact, muscle activity, and electrical interference can also affect signal quality. Dr. Jewell emphasized that understanding these limitations is essential for using POC EEG appropriately and determining when conventional EEG is still needed.
Can AI diagnose seizures?
AI tools can assist with seizure detection, but it does not replace physician interpretation. Many point-of-care EEG systems use AI algorithms to identify patients with high seizure burden and generate alerts for bedside clinicians. While these tools can improve workflow and prioritize urgent cases, Dr. Jewell stressed that AI outputs must always be interpreted within the broader clinical context. Final diagnosis and treatment decisions remain the responsibility of experienced clinicians.
Is point-of-care EEG useful after cardiac arrest?
Yes. Dr. Jewell included stroke among the clinical applications of point-of-care EEG and presented a case of a patient with prior stroke who developed sudden unresponsiveness. In these situations, rapid EEG can help determine whether ongoing seizure activity is contributing to the patient’s neurological condition and support early treatment decisions
Is point-of-care EEG useful in stroke patients?
Yes. Point-of-care EEG can complement the evaluation of patients with suspected stroke by helping clinicians identify seizures that may mimic or accompany acute cerebrovascular events. Although EEG does not replace neuroimaging, it can provide additional physiologic information in patients with altered mental status, fluctuating neurological deficits, or concern for nonconvulsive seizures during stroke evaluation.
Can point-of-care EEG reduce hospital transfers?
According to studies reviewed during the webinar, point-of-care EEG may reduce unnecessary transfers, particularly in community and resource-limited hospitals. Earlier access to EEG can support local decision-making, reduce delays in diagnosis, lower costs, and decrease hospital and ICU length of stay.
What is the future of point-of-care EEG?
According to Dr. Jewell, the future of point-of-care EEG extends beyond rapid seizure detection. Advances in artificial intelligence, quantitative EEG, wearable full-head systems, and remote interpretation are expected to further improve access to neurological monitoring. Ongoing research is also exploring new applications in prehospital care, traumatic brain injury, delirium, and neuroprognostication. As the technology continues to evolve, point-of-care EEG is likely to become an increasingly important component of emergency and critical care workflows – always as a complement to, rather than a replacement for, conventional EEG.
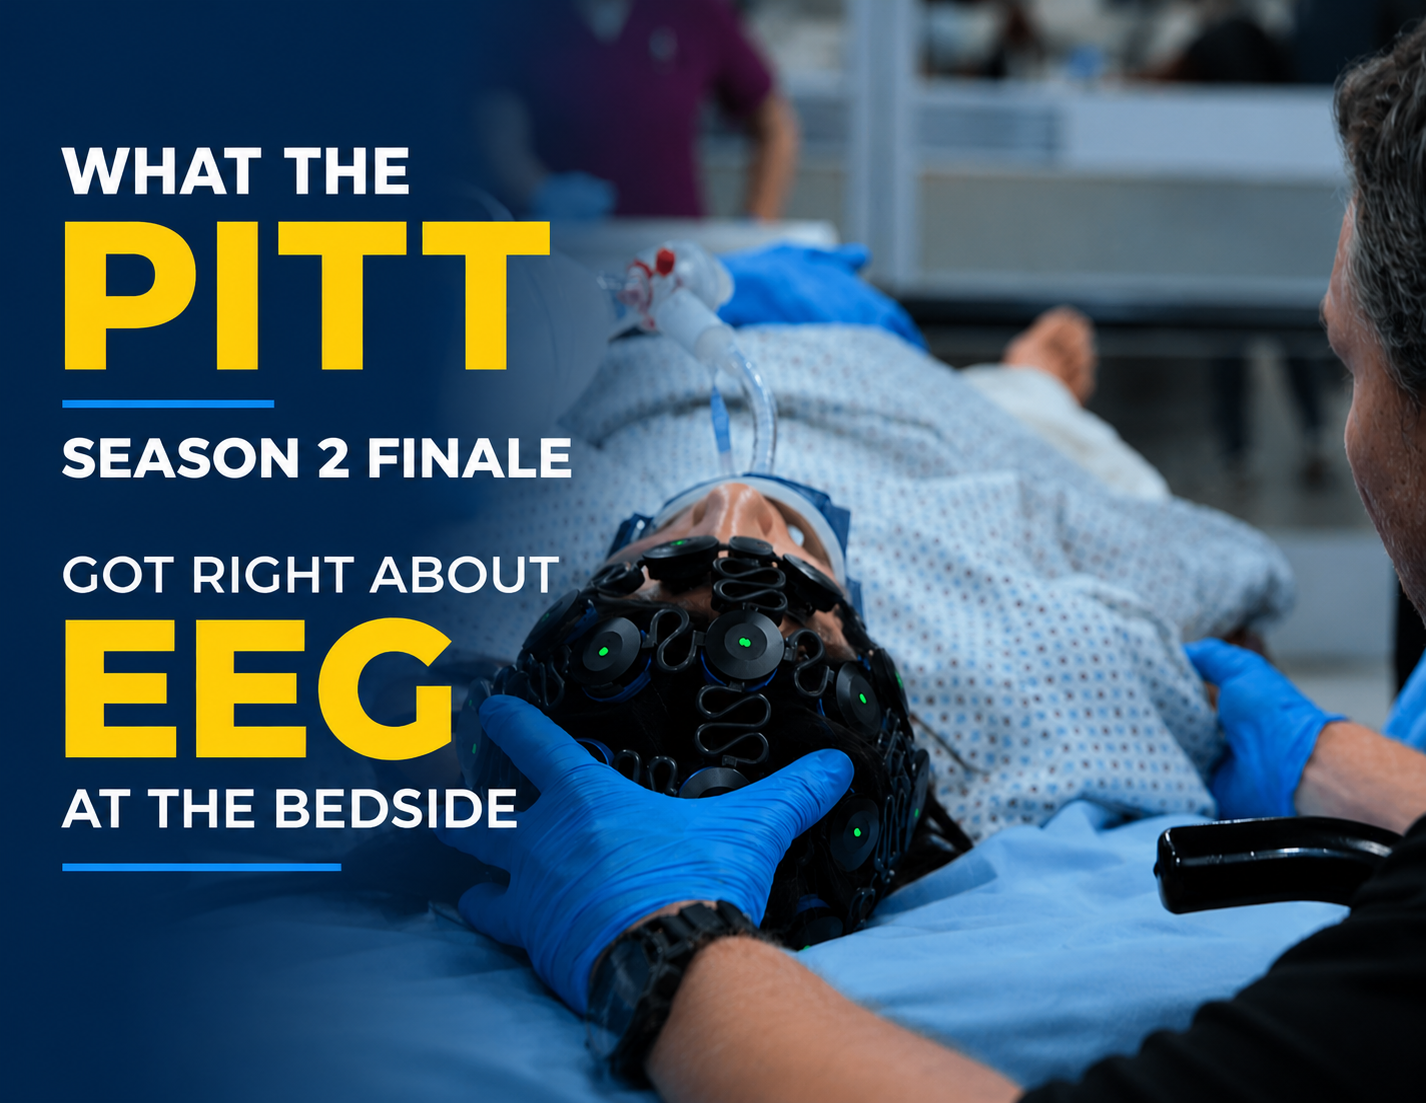
Screenshot from Season 2, Episode 15 of The Pitt (HBO Max).
Medical dramas often capture urgency well – but not always the realities of clinical workflow, especially when it comes to diagnostics like EEG.
The Season 2 finale of The Pitt stands out for a different reason. In a critical moment, it accurately reflects a common challenge in acute care: making decisions when neurologic status is uncertain and access to EEG isn’t immediate.
Video clip from Season 2, Episode 15 of The Pitt (HBO Max).
A Familiar Scenario
In the episode, a pregnant patient presents with signs of severe preeclampsia and rapidly deteriorates. She develops seizures, requiring immediate stabilization and escalation of care.
Amid this, a key clinical question emerges:
Is there ongoing seizure activity?
Seizures may or may not be visible – and are not always continuous. In critically ill patients, clinical presentation can evolve quickly, and without EEG, it can be difficult to determine whether seizure activity is present, ongoing or has resolved.
Where the Episode Gets It Right
Rather than relying on assumption, the team initiates EEG at the bedside using Zeto ONE, with support from NeuroPulseTM – an AI seizure detection tool that helps identify seizure activity in real time and calculate seizure burden, or the total duration of seizure activity over time.
In high-acuity or continuously monitored patients, this type of support can help surface relevant events more efficiently and reduce reliance on constant manual review, while keeping interpretation within the clinical team.
Within moments, they have an answer. “That was fast.”
The whole scene is just a few minutes, but it reflects something meaningful: access to neurologic data in real time, during active decision-making – not after the fact.
Why That Matters in Practice
Screenshot from Season 2, Episode 15 of The Pitt (HBO Max).
Seizures are not always obvious, and in critically ill patients, clinical presentation can evolve quickly or there may be no clinical signs at all. Without EEG, it can be difficult to determine whether there is ongoing seizure activity and the need for intervention.
Seizures in critically ill patients are more common – and more hidden – than many realize.
Across ICU populations, seizures occur in ~3%–34% of patients (Varelas et al., 2013, Seizures and the Neurosurgical Intensive Care Unit), with 10%–20% detected only on EEG (Hirsch & Gopaul, 2026, EEG in the Critical Care Setting)
In comatose patients, the risk is even higher, with up to one-third experiencing electrographic seizures and ~8%–20% in nonconvulsive status epilepticus, often without visible signs (Claassen et al., Neurology, 2004; Neurocritical Care Society Guidelines).
The takeaway is clear: without rapid access to EEG, critical neurologic events can be missed. As seen in The Pitt, solutions like Zeto help bring EEG to the bedside faster – when every minute matters.
In many settings, access to EEG depends on staffing, equipment availability, or workflow constraints. As a result, decisions are sometimes made without real-time confirmation.
Timely EEG doesn’t simplify complex cases – but it helps clarify them. By providing objective insight into current brain activity, it allows clinicians to confirm or rule out ongoing seizure activity in real time.
When seizures are ongoing, that information can support earlier initiation or escalation of anti-seizure treatment. When they are not, it can help avoid unnecessary intervention and shift focus to the underlying cause.
In high-acuity settings, that clarity can influence both prioritization and next steps.
Reflecting a Broader Shift
While dramatized, the workflow shown in The Pitt aligns with a broader trend: bringing diagnostics closer to the bedside.
Point-of-care EEG systems, including Zeto ONE, are part of that shift – aimed at reducing delays between clinical questions and neurologic data.
It also notes the inclusion of real-world medical technologies:
“The Pitt often features the latest real-world medical technology, such as this cap that quickly measures electrical activity in the brain (EEG).”
Final Thought
What The Pitt gets right is not just the clinical intensity, but the uncertainty that comes with it – and the importance of resolving that uncertainty quickly.
In practice, access to timely information often shapes decisions and improves outcomes.
Where to watch:
The full TV show and episode 15 is available on HBO Max: LINK Watch the trailer here: LINK
Seizures are the defining signature of epilepsy. Because they manifest as abnormal electrical activity in the brain, they can be detected using electroencephalography (EEG) – in theory. In practice, seizure detection is notoriously difficult. Patterns vary widely, are often subtle, and are frequently obscured by noise. Distinguishing true epileptiform activity from normal EEG variants requires years of training.
Enter machine learning. Seizure detection has become a prime target for automation, and the motivation is obvious: trained EEG specialists are scarce, clinical workloads are growing, and rapid interpretation is often critical. The result is an intense race among EEG manufacturers and software developers to build automated detection systems.
With each new system, the numbers look better – sensitivities climb, false alarm rates drop, algorithms appear increasingly reliable. But look closer, and problems become evident: most of these claims are impossible to compare. Studies use different datasets, different definitions of what counts as a detected seizure, and different evaluation procedures. Without accepted benchmarks or reporting standards, performance metrics can easily create an illusion of progress.
This blog series examines the methodological loopholes behind that illusion. We’re not focused on how seizure-detection algorithms work – but on how their performance is measured, reported, and sometimes manipulated. Our goal is to help physicians, researchers, and decision-makers cut through the fog surrounding automated seizure detection claims.
A series of 4 blogs will cover a wide range of topics:
Medical diagnostic tools are typically evaluated using signal detection theory, which assumes an “ideal observer” can optimally separate signal from noise. In seizure detection, the signal represents the predominant ‘abnormal’ EEG pattern during true electrographic seizures, while noise encompasses everything else—including ‘normal’ background EEG and other types of abnormal non-epileptoform activity.
Figure 1: Seizure vs. motion artifact. A simple amplitude threshold function would often confuse motion artifacts with seizures and increase the rate of false positives. This would lead to decreased specificity and accuracy. Therefore, advanced seizure detection methods require complex algorithms to achieve higher specificity.
According to this theory, signals can be separated from noise as long as they don’t completely overlap. For example, EEG amplitude generally increases during seizures. By analyzing the distribution of amplitude values during seizure versus non-seizure periods, we can identify patterns that distinguish these two states.
However, reality is more complex. Motion artifacts can produce high-amplitude signals that mimic seizures (see Figure 1), leading to false positive detections. This is why sophisticated algorithms are necessary to achieve high specificity in real-world applications.
The Contingency Table
Table 1: Binary contingency table
When scanning an EEG and making binary seizure/non-seizure decisions, four outcomes are possible:
False Positives (FP): Incorrectly flagging non-seizure activity as seizures
False Negatives (FN): Missing actual seizures
These four categories form the basis for calculating performance metrics. This table is also often called a ‘confusion matrix’ and it provides an indispensable visual snapshot of classifier performance, revealing not just whether an algorithm works, but precisely how and where it succeeds or fails [4].
Impact of false assessments in Seizure Detection
An ideal seizure detection algorithm would produce a matrix with strong diagonal values (correct classifications) and zeros in all off-diagonal cells (no errors). In reality, the goal is to maximize correct detections while minimizing mistakes – but not all mistakes carry equal weight. False positives and false negatives have different clinical consequences.
False Negatives. Missing several individual seizure events within an EEG study might prompt a medication adjustment but typically won’t alter a patient’s epilepsy diagnosis. Though missing life-threatening non-convulsive status epilepticus in an ICU patient altogether can be catastrophic.
False Positives. Conversely, false detections can lead to misdiagnosis of epilepsy in healthy individuals, affecting their quality of life, employment, and driving privileges. In operational settings, excessive false alarms create another problem: alarm fatigue. When clinicians are inundated with false alerts, they may become desensitized and slower to respond to real emergencies, which is why precision matters as much as sensitivity.
What is “Detection”
One critical yet often overlooked aspect is the definition of “detection” itself. To validate the accuracy of an algorithm for seizure detection, human expert physicians score a given set of EEGs and their readings are then compared to the automated results.
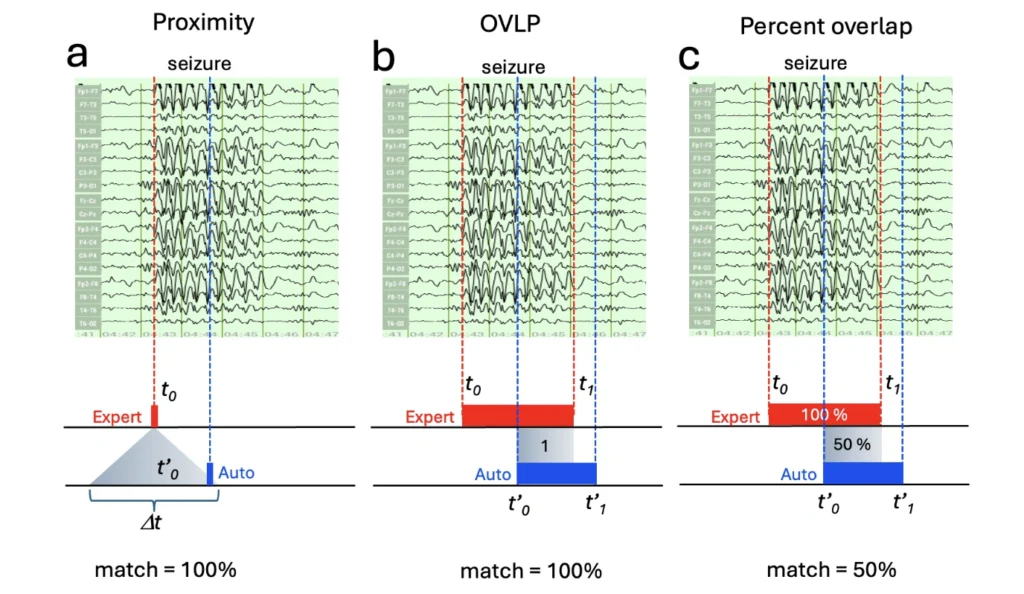
The simplest approach uses temporal proximity-based detection: counting a ‘detection’ when the algorithm-identified event falls within any time window (Δt) of the expert-annotated onset (Figure 2a). There does not have to be a complete overlap to receive a 100% score. A more sophisticated class of methods uses the overlap between the machine-detected and expert-annotated seizure intervals. In this class, most studies use the binary “Overlap” (or short “OVLP”) method (Figure 2b), which considers any overlap between the detected and expert-annotated seizure interval as a hit (TP) [3]. However, the most accurate quantification of match is the percentage overlap or Time-aligned Event Scoring (TAES) method between expert-annotated and algorithm-detected seizure intervals (Figure 2c). These three different approaches can yield dramatically different results [6].
A proximity approach might count any partial detection as a correct “hit” while an overlap approach would reveal a more differentiated picture. For example, a 30-second temporal overlap between a human expert annotation and the algorithm score on a 60 seconds seizure would represent only a 50% overlap. As a result, a study reporting 95% sensitivity using proximity or OVLP detection might show only 70% average overlap with the percentage overlap approach. In all three cases, the algorithm performed equally ‘well’, but these results are reported with a different intent. Using the proximityapproach helps to communicate how well the algorithm finds a similar number of seizure events. The overlap approach, however, also is able to make a statement about how similar the algorithm is to the expert human read in its temporal accuracy. Neither approach is wrong, but not considering these detection details can lead to widely different assessments of an algorithm’s efficiency.
It is entirely possible that a proximity-based detection overinflates the perceived performance of an algorithm by the mere circumstance that only the edges of the algorithm read aligns with the expert human assessment. Assessing the same algorithm outcome using the percent overlap approach would yield lower scores.
Figure 2. Proximity and two types of overlap based seizure detection. The same seizure detection error can be quantified and reported with strikingly different results as illustrated in panels a, b and c. (a) Proximity based seizure detection defines an acceptance window (dt) around the true seizure onset. (b) OVLP (short for overlap) detects any overlap between expert-annotated and auto-detected seizure intervals. The overlap here is binary (yes/no), meaning it is a “yes” even when the overlap is only 1 ms. (c) The percent overlap method defines time intervals between seizure onset and offset for both expert-annotated and auto-detected seizures, and calculates the percent overlap between the two relative to the expert-annotated seizure interval. “Match” percentages at the bottom are the reported matches using specific methods.
While most seizure detection performance reports use proximity or OVLP methods, Zeto’s automated algorithm applies the more conservative percent overlap method for precisely quantifying seizure detection. It requires not only determining the seizure onset but also seizure offset times, and extra information is not always available from annotations of open-access EEG seizure databases.
Practical considerations
When evaluating published metrics, always ask: How was “detection” defined? What time window or overlap threshold was used? Are both onset and offset considered, or only onset? Without this context, confusion matrices and derived metrics lack essential interpretability.
The confusion matrix serves as a diagnostic window into classifier behavior, but its value depends entirely on understanding these methodological choices – distinguishing algorithms that merely look good on paper from those delivering genuine clinical value.
Throughout this series, we won’t cover the algorithms behind seizure detection methods themselves -several recent reviews do that [1, 7, 9, 12].
We also won’t attempt a systematic comparison of detection systems. Commercial algorithms are proprietary and often patent-protected, making them impossible to evaluate directly. In contrast, academic algorithms are often open-source and more comparable – but with half the landscape hidden behind trade secrecy, any head-to-head comparison would be fundamentally incomplete.
That gap is itself part of the problem. Instead of comparing algorithms, we focus on something more tractable: the loopholes and biases in reporting practices that shape how all of these seizure detection methods are perceived and judged.
References:
Bai, L., Litscher, G., & Li, X. (2025). Epileptic Seizure Detection Using Machine Learning: A Systematic Review and Meta-Analysis. Brain sciences, 15(6), 634. https://doi.org/10.3390/brainsci15060634
Baghdadi, A., Fourati, R., Aribi, Y. et al. A channel-wise attention-based representation learning method for epileptic seizure detection and type classification. J Ambient Intell Human Comput 14, 9403–9418 (2023). https://doi.org/10.1007/s12652-023-04609-6
Gotman, J., Flanagan, D., Zhang, J., & Rosenblatt, B. (1997). Automatic seizure detection in the newborn: methods and initial evaluation. Electroencephalography and clinical neurophysiology, 103(3), 356–362. https://doi.org/10.1016/s0013-4694(97)00003-9
Khurshid, D., Wahid, F., Ali, S., Gumaei, A. H., Alzanin, S. M., & Mosleh, M. A. A. (2024). A deep neural network-based approach for seizure activity recognition of epilepsy sufferers. Frontiers in medicine, 11, 1405848. https://doi.org/10.3389/fmed.2024.1405848
Kunekar, P., Gupta, M.K. & Gaur, P. Detection of epileptic seizure in EEG signals using machine learning and deep learning techniques. J. Eng. Appl. Sci. 71, 21 (2024). https://doi.org/10.1186/s44147-023-00353-y
Lee, K., Jeong, H., Kim, S., Yang, D., Kang, H. C., & Choi, E. (2022). Real-time seizure detection using EEG: a comprehensive comparison of recent approaches under a realistic setting. arXiv preprint arXiv:2201.08780.
Li, W., Wang, G., Lei, X., Sheng, D., Yu, T., & Wang, G. (2022). Seizure detection based on wearable devices: A review of device, mechanism, and algorithm. Acta neurologica Scandinavica, 146(6), 723–731. https://doi.org/10.1111/ane.13716
Slama, K., Yahyaouy, A., Riffi, J., Mahraz, M. A., & Tairi, H. (2025). Comprehensive review of machine learning and deep learning techniques for epileptic seizure detection and prediction based on neuroimaging modalities. Visual computing for industry, biomedicine, and art, 8(1), 27. https://doi.org/10.1186/s42492-025-00208-8
Torkey, H., Hashish, S., Souissi, S., Hemdan, E. E. D., & Sayed, A. (2025). Seizure Detection in Medical IoT: Hybrid CNN-LSTM-GRU Model with Data Balancing and XAI Integration. Algorithms, 18(2), 77.
Wilson, S. B., Scheuer, M. L., Plummer, C., Young, B., & Pacia, S. (2003). Seizure detection: correlation of human experts. Clinical neurophysiology : official journal of the International Federation of Clinical Neurophysiology, 114(11), 2156–2164. https://doi.org/10.1016/s1388-2457(03)00212-8
Zhang X, Zhang X, Huang Q and Chen F (2024) A review of epilepsy detection and prediction methods based on EEG signal processing and deep learning. Front. Neurosci. 18:1468967. doi: 10.3389/fnins.2024.1468967
In the first blog of our Understanding Seizure Detection series, we summarized different approaches on how to define “seizure detection”. In this blog we introduce different ways to help understand and visualize the performance of a seizure detection algorithm. The Receiver Operation Characteristics (ROC), and F1-Score are two popular methods used for that purpose.
The ROC Curve
The Receiver Operating Characteristic (ROC) curve visualizes the trade-off between detecting true seizures and generating false alarms across different detection thresholds. As the separability between signal and noise increases, the area under the ROC curve (AUC) approaches 1. When signal and noise completely overlap, the AUC approaches 0.5. The AUC value, also called choice probability, provides a sensitive measure of how well an EEG feature can differentiate seizure from non-seizure activity (Figure 1).
In other words, a high area under the curve signifies that a seizure algorithm is accurately detecting a seizure. An AUC of 1 equals a perfect 100% accurate categorization. An AUC of 0.5, however, would signify that the algorithm would only be detecting a seizure by chance. AUC values under 0.5 would be even worse, signifying that an algorithm identifies the target signal even below chance.
To find out how we derive useful performance metrics from contingency tables and confusion matrices, see our next chapter on Understanding Performance Metrics.
Understanding Performance Metrics
Sensitivity and Specificity
Diagnostic accuracy is typically expressed through sensitivity, specificity, False Positive Rate, and Precision:
Sensitivity (Recall or Positive Percent Agreement): The proportion of actual seizures correctly identified (TP / [TP + FN])
Specificity (Negative Percent Agreement): The proportion of non-seizure activity correctly identified (TN / [TN + FP])
False Positive Rate: (1-Specificity)
Precision: The accuracy of positive predictions (TP / [TP + FP])
Deep-Dive: F1 Score
The F1 score balances precision and sensitivity into a single metric using their harmonic mean: 2 × (Precision × Sensitivity) / (Precision + Sensitivity). This score ranges from 0 to 1, where 1 represents perfect detection.The F1 score is particularly valuable for imbalanced datasets—a common situation in EEG analysis where non-seizure data vastly outnumbers seizure data. A detection algorithm with a very low threshold might catch every seizure (high recall) but also generate numerous false alarms (low precision). The F1 score provides a balanced assessment that reflects real-world utility where both sensitivity and false-alarm rates matter equally (Figure 2).
Figure 2: F1-contours and testing new models. On the left are the F1 contours that represent the expected Precision (P) as a function of Recall (R) for any given F1 score. On the right, the F1-countours were plotted for specific seizure detection models, with a test model’s F1 curve overlaid. This representation enables us to compare the test-model’s performance with other models. The blue curve represents the test model performance with a specific point highlights the part of the curve where the expected Precision at a given Recall level (Recall ~ 0.6) is 0.75, higher than in other models (courtesy of Bálint Csanády and the Zeto AI team).
The problem of Ground Truth: Inter-Rater Agreement
Performance metrics assume we have an objective “ground truth” to compare against. In seizure detection, this ground truth comes from expert EEG readers with years of experience. However, this foundation becomes shaky when we examine inter-rater agreement.
Research shows that even expert physicians can disagree substantially. In our own study, three independent experts reviewing the same EEG data agreed on only 54% of seizures (Figure 3). This high variability in inter-rater assessments raises serious questions about the reliability of sensitivity, specificity, and F1 scores.
It is crucial to maintain the statistical representativeness of the physicians reviewing the test data. First of all, the rating physicians must be blinded to each others’ seizure annotations, otherwise one physician’s seizure annotation may influence others’. It is also recommended to elect independent readers of geographically and professionally distant areas, because physicians trained in the same school, working as residents under shared supervision, or have been co-workers may bias the inter-rater agreement, and decrease the representativeness of expert opinion. A study aiming for objectivity should mitigate these types of biases.
Figure 3: Inter-rater agreement: This Venn diagram illustrates the concordance of seizure ratings among three independent EEG reading experts (Experts 1-3). Experts are color-coded. In this sample of EEGs, 18.38% of samples were classified as seizure suspicion and 81.62% as non-seizures. From the 18.38% seizure suspicions, only 10.1% overlapped, indicating a 55% inter-rater agreement (based on internal Zeto data).
Take Away
Therefore, investigators must report a Positive Percent Agreement (PPA) and a Negative Percent Agreement (NPA) for the raters to quantify the concordance of the annotations of independent experts.
Several approaches can help manage this uncertainty:
Conservative approach: Use only seizures identified by all experts (intersection). This yields high confidence ratings but excludes many valid seizure episodes if they were missed by just one expert. It provides the smallest number of validated seizures.
Moderate approach: Require agreement from more than one but not all experts. This balances confidence with data availability.
Liberal approach: Include all seizures identified by any expert. This maximizes data but reduces consensus. It provides the largest number of validated seizures.
Ideally, consensus scoring across many raters provides a more robust ground truth. However, this variability means that no published F1 score has absolute validity. These metrics change when different expert readers are involved, making claims of 100% recall or F1 scores questionable and sample-dependent.
Finally, inter-rater variability is highly sensitive to the method we determine the overlap between expert readers’ definitions of seizures. If we apply the “percent overlap” (discussed in Blog 1: “How to Define Seizure Detection”) between seizure events defined by their onset and offset times, the disagreement can be significant even if the experts agree on the onset but disagree on the offset time. Therefore, reported inter-rater agreements are usually high (>90%) because most investigators consider an agreement perfect when the seizure onset asynchrony does not exceed a predefined ΔT interval (usually a few seconds) and ignore the offset asynchrony. This topic will be further elaborated next.
Temporal Considerations: Seizure Onset and Offset
Seizures have relatively well-defined onset times but much less clear offset times. Seizures often taper gradually, making the endpoint a matter of clinical judgment rather than objective measurement. Some clinicians consider the seizure to be ended when the EEG returns to near-normal, while others use the transition from periodic to aperiodic patterns as the endpoint.
This ambiguity particularly affects the diagnosis of electrographic status epilepticus (ESE), which is defined by total seizure duration thresholds (10% continuous or 12% fragmented seizures over an hour). Since offset time uncertainty directly impacts duration calculations, it can influence critical clinical decisions.
Take Away
Expert raters generally show higher agreement on seizure onset than offset times, adding another layer of complexity to performance validation.
The Electrode Coverage Dilemma
An often-underestimated factor in seizure detection is electrode montage and coverage. Clinical EEG systems range from partial limited montage (headbands, single electrodes) to full montage coverage (headcaps or individually attached electrodes with standardized electrode positions). Most comply with the 10-20 system, which ensures reproducible electrode placement.
Reduced montage electrode coverage introduces an inherent bias by failing to capture all possible seizures, particularly focal seizures confined to brain regions outside the electrode array. As a result, reduced montages cannot establish a complete ground truth for seizure occurrence. Nevertheless, some studies define ground truth using reduced montages rather than full electrode coverage. As a result, it becomes easier to report perfect sensitivity and high specificity when the ground truth is limited to partial montages. This is particularly likely when algorithm performance is evaluated against expert consensus derived from the same reduced electrode set, which may miss seizures occurring outside the monitored regions. In other words, if the ground truth includes only seizures visible within the partial montage—and excludes seizures occurring beyond it—then failing to detect those excluded seizures will not negatively affect performance scores. Readers should therefore be cautious about overvaluing high sensitivity or specificity reported for algorithms based on limited montages.
In contrast, several studies recommend to define the ground truth using expert annotations based on full-montage EEG recordings [1, 3, 5, 7, 9]. When evaluated against this more comprehensive reference, partial montage (reduced-electrode-set) approaches yielded more moderate performance, with reported sensitivities around 75% and specificities near 97%. Notably, none of these studies claimed perfect sensitivity. But that is also a more realistic and statistically plausible outcome, because this more prudent assessment strategy is not subject to the inherent bias of partial montage approaches.
Given the inherent bias of using reduced montage EEG as ground truth, it is not surprising that some algorithms based on partial montages report 100 % sensitivity. Such results beg the question how they can be even better than the concordance between blinded human readers evaluating either reduced montage or full coverage EEG records – it can’t and this simply illustrates the inherent bias of such partial montage approaches. To bring some clarity to the source of contradicting results that approaches like that may produce is a recent multi-center study (AccuRASE) evaluating seizure detection performance of partial montage based seizure detection methods and found only 29% sensitivity (low-to-moderate), but relatively high, >90% specificity [8]. This study used full montage ground truth as opposed to a partial montage.
The above example illustrates how important it is to maximize the objectivity of ground truth dataset. The misrepresentation of ground truth may also create the false impression that reduced montages perform as well or even better than full montages. Please note, that specificity (false positive ratio) is relatively immune to the reduced montage bias, because it is only affected by the true negatives and false positives; neither of which is related to missed seizures.
In other words, by reducing the available electrodes to assess the ground truth, sensitivity assessments based on partial montages risk over-estismate true sensitivity values. Approaches based on full montage ground-truth data have a higher likelihood to score lower sensitivity values simply because of the inclusion of additional ground truth channels in the central head regions. Full montage assessments may well be much more sensitive as a result but that won’t be reflected in their sensitivity values compared to values achieved by partial montage approaches. The simple take-away is that reducing ground-truth coverage introduces a bias towards higher sensitivity scores.
Take Away
Best practice: When evaluating non-standard or partial-coverage montages, ground truth should always be determined using full-coverage, expert-reviewed EEG data.
Achieving unbiased performance metrics is paramount in seizure detection. However, performance evaluation is only half the story—the training dataset plays an equally critical role. To understand how training data fundamentally shapes seizure detection performance, see Blog 3: “The Critical Role of Training Data”.
Deep-Dive: Factors That Complicate Study Comparisons
The literature on the effect of reduced electrode montages on seizure detection is mixed and often shaped by study design and sponsorship [1-7]. Industry-sponsored studies tend to report high concordance between reduced and full montages in seizure detection sensitivity, with little effect on specificity — a finding that is unsurprising given that vendors design these studies to support the equivalence of their systems and emphasize similarity in outcomes [1, 2]. Independent studies, by contrast, more often highlight meaningful differences and report losses in sensitivity with reduced coverage.
Beyond sponsorship bias, several clinical and technical factors complicate direct comparisons across studies.
The first is time to EEG. In many acute settings, rapid electrode application is critical. When setup speed is clinically decisive, the practical benefit of a reduced montage system may outweigh the information lost through limited spatial coverage, justifying its use even if sensitivity is modestly lower.
The second is patient age. EEG monitoring is strongly recommended in neonates when hypoxic-ischemic injury is suspected or following complicated deliveries. Neonatal-specific reduced montages focus on the frontal and central regions, which carry the highest diagnostic relevance in this population. Given the ease of application and the reduced discomfort for newborns, a targeted reduced montage is often considered sufficient in this context [6].
The third is electrode configuration. Not all reduced montages are equivalent. For seizure detection, temporal lobe coverage is particularly important, as temporal-onset seizures are among the most common. Montages or headband systems that include temporal electrodes are therefore meaningfully better positioned to capture focal seizures than those that do not.
The fourth is seizure type. Reduced montage systems can reliably detect focal seizures with an onset within or near the covered electrodes, but will likely miss focal seizures arising outside the zone of coverage. Generalized seizures, given their broad spatial distribution, are well captured even by reduced montage sets [1,3].
When comparing published studies quantitatively, a clear performance gap emerges: studies reporting sensitivity around 95% for reduced montages stand in stark contrast to those reporting sensitivity below 85%, underscoring how strongly methodology, montage design, and patient population drive reported outcomes.
The fact that reduced montages affect the sensitivity more than specificity is reasonable, since the reduced montage leads to more misses (FN) rather than increasing false detections (FP), where FN affects sensitivity and FP affects specificity.
References:
Tacke, M., Janson, K., Vill, K. et al. Effects of a reduction of the number of electrodes in the EEG montage on the number of identified seizure patterns. Sci Rep 12, 4621 (2022). https://doi.org/10.1038/s41598-022-08628-9
Westover, M. B., Gururangan, K., Markert, M. S., Blond, B. N., Lai, S., Benard, S., Bickel, S., Hirsch, L. J., & Parvizi, J. (2020). Diagnostic Value of Electroencephalography with Ten Electrodes in Critically Ill Patients. Neurocritical care, 33(2), 479–490. https://doi.org/10.1007/s12028-019-00911-4
Frankel, M. A., Lehmkuhle, M. J., Spitz, M. C., Newman, B. J., Richards, S. V., & Arain, A. M. (2021). Wearable Reduced-Channel EEG System for Remote Seizure Monitoring. Frontiers in neurology, 12, 728484.
Ma, B. B., Johnson, E. L., & Ritzl, E. K. (2018). Sensitivity of a Reduced EEG Montage for Seizure Detection in the Neurocritical Care Setting. Journal of clinical neurophysiology : official publication of the American Electroencephalographic Society, 35(3), 256–262. https://doi.org/10.1097/WNP.0000000000000463
R. Asif, S. Saleem, S. A. Hassan, S. A. Alharbi and A. M. Kamboh, “Epileptic Seizure Detection With a Reduced Montage: A Way Forward for Ambulatory EEG Devices,” in IEEE Access, vol. 8, pp. 65880-65890, 2020, https://doi: 10.1109/ACCESS.2020.2983917
Lin, Y. C., Lin, H. A., Chang, M. L., & Lin, S. F. (2025). Diagnostic accuracy of reduced electroencephalography montages for seizure detection: A frequentist and Bayesian meta-analysis. Neurophysiologie clinique = Clinical neurophysiology, 55(2), 103044. https://doi.org/10.1016/j.neucli.2025.103044
Stevenson, N. J., Lauronen, L., & Vanhatalo, S. (2018). The effect of reducing EEG electrode number on the visual interpretation of the human expert for neonatal seizure detection. Clinical neurophysiology : official journal of the International Federation of Clinical Neurophysiology, 129(1), 265–270. https://doi.org/10.1016/j.clinph.2017.10.031
Study
Types of seizure
Sensitivity Full montage [%]
Sensitivit y Partial Montage [%]
Specificity Full montage [%]
Specificity Partial montage [%]
1
Westover, et al (2020)
ICU
97.5 81.8
100 94.4
2
Frankel, et al (2021).
90
90
3
Ma, Johnson, & Ritzl (2018)
Seizure ESE
81 69
92 97
4
Asif,et al. (2020).
95
92
99
99
5
Lin et al, (2025).
<8 electrodes >8
7566 77
97
97
6
Stevenson, Lauronen & Vanhatalo. (2018)
18% of seizures detected in the 19-electrode montage were not detected in the 8- or 4-electrode montage
100
70
7
Tacke et al. (2022).
0.76
0.65*
0.96
0.97
Table 1. Representative studies comparing seizure detection performance between full and partial montage electrodes.
References
Asif, R., Saleem, S., Hassan, S. A., Alharbi, S. A., & Kamboh, A. M. (2020). Epileptic seizure detection with a reduced montage: A way forward for ambulatory EEG devices. IEEE Access, 8, 65880-65890. https://ieeexplore.ieee.org/stamp/stamp.jsp?arnumber=9050500
Backman, S., Cronberg, T., Rosén, I., & Westhall, E. (2020). Reduced EEG montage has a high accuracy in the post cardiac arrest setting. Clinical Neurophysiology, 131(9), 2216–2223. https://doi.org/10.1016/j.clinph.2020.06.021
Frankel, M. A., Lehmkuhle, M. J., Spitz, M. C., Newman, B. J., Richards, S. V., & Arain, A. M. (2021). Wearable Reduced-Channel EEG System for Remote Seizure Monitoring. Frontiers in neurology, 12, 728484. https://doi.org/10.3389/fneur.2021.728484
Grant, A. C., Abdel-Baki, S. G., Weedon, J., Arnedo, V., Chari, G., Koziorynska, E., Lushbough, C., Maus, D., McSween, T., Mortati, K. A., Reznikov, A., & Omurtag, A. (2014). EEG interpretation reliability and interpreter confidence: a large single-center study. Epilepsy & behavior : E&B, 32, 102–107. https://doi.org/10.1016/j.yebeh.2014.01.011
Lin, Y. C., Lin, H. A., Chang, M. L., & Lin, S. F. (2025). Diagnostic accuracy of reduced electroencephalography montages for seizure detection: A frequentist and Bayesian meta-analysis. Neurophysiologie clinique = Clinical neurophysiology, 55(2), 103044. https://doi.org/10.1016/j.neucli.2025.103044
Ma, B. B., Johnson, E. L., & Ritzl, E. K. (2018). Sensitivity of a Reduced EEG Montage for Seizure Detection in the Neurocritical Care Setting. Journal of clinical neurophysiology : official publication of the American Electroencephalographic Society, 35(3), 256–262. https://doi.org/10.1097/WNP.0000000000000463
Sheikh, Z. B., Dhakar, M. B., Fong, M. W. K., Fang, W., Ayub, N., Molino, J., Haider, H. A., Foreman, B., Gilmore, E., Mizrahi, M., Karakis, I., Schmitt, S. E., Osman, G., Yoo, J. Y., & Hirsch, L. J. (2025). Accuracy of a Rapid-Response EEG’s Automated Seizure-Burden Estimator: AccuRASE Study. Neurology, 104(2), e210234. https://doi.org/10.1212/WNL.0000000000210234
Westover, M. B., Gururangan, K., Markert, M. S., Blond, B. N., Lai, S., Benard, S., Bickel, S., Hirsch, L. J., & Parvizi, J. (2020). Diagnostic value of electroencephalography with ten electrodes in critically ill patients. Neurocritical Care, 33(2), 479–490. https://doi.org/10.1007/s12028-019-00911-4
The training dataset fundamentally determines where an algorithm will work effectively. An algorithm trained exclusively on ICU data – where patients are often sedated with minimal motion artifacts – will generate excessive false alarms in routine EEG settings where patients move freely. Conversely, algorithms trained only on awake patients will generate a lot of false pathologicalslow oscillations in critical care settings, where those slow oscillations are natural delta waves of the sedated brain. Similarly, none of these seizure detection algorithms will work for patients in transport (airlifted or ambulance cars) unless the EEG is denoised for the mechanical and electromagnetic artifacts before processing.
Public Datasets
Several public databases support algorithm development, but each of them has advantages and disadvantages depending on the seizure detection objectives.
Limitations: It is a very limited dataset (1 channel each) with minimal artifacts, hence limiting generalizability. In addition, no seizure offset annotations.
Description: Includes the TUH EEG Epilepsy Corpus (TUEP) and TUH EEG Seizure Corpus (TUSZ) with thousands of annotated recordings from various settings (routine, EMU, ICU), including both seizure and non-seizure data. The different TUH datasets overlap.
Limitations: It is an overall good resource, but it contains a broad quality range of EEGs recorded in diverse settings, from routine to ICU data. It is good for developing robust, quality-insensitive seizure detection algorithms, but has a limited use for parameter fine-tuning.
Description: Contains 284,343 EEG studies from 109,178 patients across four sites, including annotated ICU, EMU, and routine EEG datasets [2]. It is a huge database (210 TB), almost ideal for foundational model development.
Limitations: However, the seizure annotations made by human experts are very limited and lack seizure offset times. Moreover, it contains long ICU recordings (> 8 hours) with very few seizures, which takes us to the next problem.
Seizure Prevalence Effects
Seizure prevalence dramatically affects performance metrics. Consider a test database consisting of 100 samples of 20-second EEG segments from patients undergoing 33-minute routine EEG recordings with rare seizure occurrences: average 1 true seizure in 100 EEG samples. If we run the data on a new seizure detection algorithm that detects 10 seizures (including the one true seizure), it would achieve:
Recall = 100% (found the only true seizure)
Precision = 10% (9 false positives)
F1 = 0.18 (severely impacted by false positives)
This demonstrates why 100% sensitivity alone is very misleading—it overlooks the critical importance of false positive rates.
Considering that seizure prevalence varies significantly across clinical settings, we have a good reason to balance the composition of our test and training datasets:
Routine EEG: Low prevalence (30-minute recordings in outpatients)
Epilepsy Monitoring Unit (EMU): High prevalence (medications withdrawn to capture seizures)
ICU: High prevalence (continuous monitoring for status epilepticus)
When evaluating published results, always consider the patient cohort and seizure prevalence, as they fundamentally affect precision and F1 scores.
Data Heterogeneity and Specialization
Age and State Considerations
EEG characteristics vary dramatically across clinical settings, demographics and populations:
Pediatric EEG differs from adult EEG
Neonatal EEG is fundamentally different from both
Sleep EEG requires different approaches than awake EEG
An F1 score reported for adults may be meaningless when applied to neonates. Similarly, algorithms trained on awake patients cannot be directly applied to sleep EEG without adjustment.
The Strategic Choice
Generalist approach: For broad applicability across diverse settings, train on similarly diverse datasets with large numbers of validated examples.
Specialist approach: For specific populations (e.g., neonates), focus training on population-specific datasets for optimal performance.
Sample Size Matters
EEG data availability is limited by privacy protections and data security requirements. Despite carefully de-identified public databases (see above), most clinical EEG data remains protected and not shared. Therefore, the available sample size for developing seizure detection methods is far from optimal.
The required dataset size depends on the approach:
Small datasets (20-100 patients up to 1,000 recordings): Sufficient for algorithms that focus on specific features like wavelet coefficients. Statistically adequate for training and testing feature-based classification.
Big datasets (100-1,000 patients up to 10,000 recordings): Necessary for convolutional neural networks that extract multidimensional parameters from larger parameter spaces.
Large datasets (>1,000 patients, more than 10,000 recordings): Required for foundational models that represent millions of features and can extract disease-specific patterns from any EEG—essentially the “large language model” equivalent for EEG analysis.
Best Practices for Transparent Reporting
Performance evaluation of seizure detection methods is not straightforward. Many parameters can significantly impact published results, and incomplete reporting leads to misinterpretation and irreproducibility. Key issues include:
Inter-rater variability
Seizure onset-offset uncertainty
Electrode coverage variations
Training data representativeness
Sample size and prevalence effects
Take Away
Recommendations
Report inter-rater reliability metrics when comparing to ground truth. Transparency about expert agreement levels provides essential context. In addition, the raters must be blinded to each other’s ratings (we described it in Blog 2, “Basic Concepts of Seizure Detection”).
Quantify temporal matching between predicted and validated seizures based on overlaps (Interval Matching OVLP, or percent overlap). This requires precise seizure duration definitions, which we discussed in Blog 1, “What is detection”.
Use full-montage EEG for ground truth estimation. This prevents inherent bias of partial incomplete electrode coverage/montage. We discuss this further in Blog 2, “The Electrode Coverage Dilemma”.
Specify training data characteristics: patient population, seizure prevalence, recording settings, and dataset (see above).
Report multiple metrics: Sensitivity, specificity, precision, and F1 score together provide a complete picture – see Blog 2, “Sensitivity and Specificity”for more details.
Until these standards become widely adopted, direct comparison between different seizure detection algorithms remains challenging. Readers should approach performance claims with healthy skepticism, asking: What was the inter-rater agreement? What electrode coverage was used? What was the seizure prevalence? Was the algorithm tested on data representative of its intended use case?
Conclusion
No single number can capture the complexity of seizure detection performance. The published F1 scores, sensitivity values, and other metrics that appear definitive are actually contingent on numerous methodological choices—from how ground truth is established to which patient populations are studied.
As the field moves toward larger annotated databases and more diverse training sets, we can develop increasingly robust foundational models. However, transparency in reporting remains essential. By understanding the factors that influence performance metrics, clinicians and researchers can better evaluate new technologies and make informed decisions about their implementation.
The goal isn’t skepticism about all published results, but rather informed interpretation that recognizes both the promise and limitations of current methods. Only through rigorous, transparent reporting can we enable fair comparison between models and drive genuine progress in automated seizure detection.
In the next blog, we address the central challenge of quantifying seizure burden (SB) and explain why reliable seizure detection is the limiting factor for both real-time alerting and longitudinal clinical assessment. Read the next blog: “Quantifying Seizure Detection“.
References
Andrzejak, R. G., Lehnertz, K., Mormann, F., Rieke, C., David, P., & Elger, C. E. (2001). Indications of nonlinear deterministic and finite-dimensional structures in time series of brain electrical activity: Dependence on recording region and brain state. Physical Review E, 64(6), 061907
Zafar, S., Loddenkemper, T., Lee, J. W., Cole, A., Goldenholz, D., Peters, J., Lam, A., Amorim, E., Chu, C., Cash, S., Moura Junior, V., Gupta, A., Ghanta, M., Fernandes, M., Sun, H., Jing, J., & Westover, M. B. (2025). Harvard Electroencephalography Database (version 4.1). Brain Data Science Platform. https://doi.org/10.60508/k85b-fc87
The first three blogs in this series introduced the quantitative terminology used to evaluate seizure detection and emphasized the critical role of training and testing datasets. Here, we address the central challenge of quantifying seizure burden (SB) and explain why reliable seizure detection is the limiting factor for both real-time alerting and longitudinal clinical assessment .
Current State of Commercial Automated Seizure Detection
Not all clinical EEG platforms incorporate automated seizure detection capabilities, but the most widely deployed commercial systems feature modular software architectures that support optional seizure recognition modules. These solutions are implemented either as third-party plugins or proprietary extensions developed by the platform manufacturer. Notable examples of third-party integrations include Persyst’s seizure detection module for Natus NeuroWorks™ and Nihon Kohden EEG systems [1], and encevis’ cloud-based detection for Zeto’s NeuroPulse™ AI-powered cloud platform [2]. Ceribell developed Clarity™, a proprietary detection algorithm integrated with their rapid-response EEG system [3,4]. A recent review features the hardware capabilities of these point-of-care EEG systems [5].
Given that both SB tracking accuracy and electrographic status epilepticus (ESE) alerting reliability are fundamentally determined by seizure detection performance, we focus our analysis on comparing detection algorithms across available solutions. Our evaluation is limited to published performance metrics and, where source code has been made publicly available, direct comparative testing on standardized datasets.
Table 1 (below) presents published performance characteristics of widely used commercial seizure detection systems. It is critical to note that these performance ranges derive from studies conducted on heterogeneous datasets with varying patient populations, recording conditions, and seizure types. (We provided recommendations in Blog 3 under “Best Practices for Transparent Reporting” to improve the consistency of reported characteristics.) Consequently, direct performance comparisons based solely on published metrics are subject to significant dataset bias, as we discussed in Blog 3, “The Critical Role of Training Data“.
Grand Truth Paradox
When evaluating seizure detection algorithms, the most critical methodological decision is how “ground truth” is defined. In medical device diagnostics, ground truth is assumed to represent the objective reality against which algorithm performance is measured. However, in seizure detection, this assumption is often fragile (see Blog 2: “The problem of Ground Truth: inter-rater agreement”). An incorrectly defined or biased ground truth can artificially inflate or suppress sensitivity and specificity. Studies that use different definitions of ground truth therefore become difficult to compare, even if their reported metrics appear similar. Because the contingency table to calculate the key performance metrics is directly affected by the ground truth (see Blog 1), the numbers enter in the table determines the sensitivity and specificity. Hence, by manipulating the ground truth one can easily enhance the performance.
“Ground truth” is not “Gold truth”
In some other diagnostic fields, an external biological standard exists (MRI, CT, etc). For example, a radiological suspicion of a tumor can be confirmed or refuted by biopsy where histopathology serves as an independent validator. In these situations, time and patient outcome of the disease state will help inform about the reality of a preceding assessment.
Seizure detection lacks such an independent confirmatory modality. The EEG pattern itself is the phenomenon of interest. Consequently, ground truth in seizure detection is anchored only to expert interpretation. This creates an epistemological limitation: the reference standard for what is seizure and what is not is inherently subjective, even when systematically constructed.
Human Expert Consensus as Ground Truth
In electroencephalography (EEG), ground truth is typically established through expert physician annotation. As discussed previously (Blog 2: “The Problem of Ground Truth: Inter-Rater Agreement“), careful expert selection, representativeness, and blinded review are essential to mitigate bias. Multi-rater consensus is commonly used to strengthen reliability. Yet consensus does not guarantee correctness.
Inter-rater agreement varies across types of EEGs (duration, clinical settings, partial or full montages and patients conditions) and across signal conditions. Agreement is typically higher when the signal-to-noise ratio is strong and the seizure is stereotypical. It decreases if the EEG is full of artifacts or contaminated by noise making it ambiguous and hard to read for human experts —precisely the scenarios where automated systems may be superior.
The goal to obtain independent and blinded scores by expert readers in EEG cannot be understated. Readers who belong to the same school of thought through identical training, will necessarily provide more similar ratings, than readers with more diverse backgrounds. Scores that are not blinded may also create an inherent interpersonal conflict between readers if they are financially or professionally dependent on one another. Neurology fellows reading under the supervision of their attending physician in an un-blinded situation may be prone to agree with their mentors scores artificially increasing the inter-rater reliability – human psychology dictates at minimum an unconscious bias towards wanting to please one’s superior.
Finally, at the moment a method requires subjective human ratings, principles of social science apply in full, suggesting that independent inter-rater scores follow a normal distribution with an average and set standard variation [6]. Even if rating scores tend to converge to a commonly high agreement in clear text-book examples of a seizure signal, perfect inter-rater agreement at 100% would be a statistical abnormality when including less clear, less ideal and more edge-case seizure morphologies into the assessment. Perfect inter-rater reliabilities, therefore become a warning sign on their own. If they are perfectly convergent, then the question begs what detection criteria were deployed (See Blog 1: proximity, overlap, percentage overlap), or what dataset characteristics might have contributed to achieve this level of alignment. Perfect inter-rater reliabilities in EEG, on diverse, multi-facetted datasets, in a truly independent, larger and diverse group of readers, are in-probable.
The Paradox of Algorithmic Superiority
We mentioned above that “… consensus does not guarantee correctness.” This is another source of confusion. A paradox emerges when a machine-learning algorithm demonstrates consistent disagreement with expert annotations—yet appears clinically plausible, internally consistent, and reproducible across datasets.
Only by recognizing and managing the “ground truth paradox” can we generate trustworthy, comparable, and clinically meaningful performance metrics.
The Relationship Between Sensitivity and Ground Truth
One of the clearest warning signs of bias in seizure detection studies is a mismatch between reported sensitivity and inter-rater agreement. The problem arises when vendor-reported sensitivity exceeds the level of agreement among expert reviewers. For example, if two independent EEG experts agree only ~80% of the time on whether a segment contains a seizure (see Blog 2, Figure 3), how can an algorithm claim 99% sensitivity against that same reference?
If Dr. X and Dr. Y agree on seizure presence 80% of the time, then an algorithm achieving 99% sensitivity must be nearly perfectly aligned with one expert while necessarily disagreeing with the other in a substantial fraction of cases. In other words, the 99% sensitivity cannot simultaneously apply to both experts unless one expert’s ratings are excluded from the reference standard.
While this practice increases internal consistency, it also reshapes the denominator of sensitivity. By excluding disputed events, the evaluation may preferentially retain clear, high signal-to-noise seizures and remove those ambiguous cases that lower inter-rater agreement. The resulting contingency table no longer reflects the full clinical reality—it reflects a filtered subset.
Take Away
Consensus based ground truth in sensitivity and specificity assessments introduce a bias towards inflated scores. Sensitivity and specificity are therefore not independent of the ground truth construction. They are downstream consequences of it.
Developers who report very high sensitivity should therefore demonstrate that these values are supported by correspondingly high, independent, blinded inter-rater agreement. If not, responsible reporting requires acknowledging that the robustness of the metric is limited by the robustness of the reference.
Why This Matters
The absence of practical reporting standards in this area has encouraged competitive sensitivity claims, often producing discrepancies between vendor-sponsored and independent studies. These discrepancies are frequently rooted not in statistical error, but in differences in dataset composition and ground truth construction.
Ultimately, real-world clinical performance will arbitrate these claims. Sensitivity that depends heavily on how disagreement cases were handled may not translate into consistent bedside performance.
Sensitivity cannot meaningfully exceed the reliability of its ground truth. When it appears to do so, the issue lies not in the algorithm—but in how the reference standard was constructed and interpreted.
Deep-Dive: The limit of statistics
We remark that the link between the sensitivity of a diagnostic method and the ground truth characteristics is not statistical. It is interpretational. Therefore, studies may apply rigorous statistical methods and honest reporting of these high >95 % sensitivity metrics.
The contradiction is the interpretation when these high sensitivity metrics meet the low inter-rated consensus. The developers of such algorithms have to confirm that the high sensitivity scores are supported by high interrater agreement. Otherwise, the honest report should say that the relatively high performance metric is weakly supported by a relatively low inter-rater agreement, which should undermine the robustness of such results. Again, the real-life use will be the ultimate testbed for those algorithms.
Time–frequency features and machine-learning classification on partial montage EEG
~29–100
~79-93
≈95–99
Moderate; decreases with low seizure burden
Persyst,Version 11 [8,9]
Expert-assisted review, seizure burden
Full 10–20 cEEG
undisclosed
undisclosed
Time–frequency analysis, morphology, rhythmicity, and spatial coherence, with deterministic + ML-assisted components.
~80–95
~70–90
High
Moderate to high after expert review
Natus NeuroWorks™ [8,10]
Continuous screening / flagging
Full 10–20 cEEG
undisclosed
undisclosed
Uses Persyst or encevis plugins to detect seizures
As in Persyst
As in Persyst
As in Persyst
As in Persyst
NeuroPulse™(encevis Version 2.1)[11,12]
ICU Rapid bedside triage / long-term monitoring for status epilepticus / continuous seizure burden
Full 10–20 cEEG
undisclosed
undisclosed
Time–frequency feature extraction Temporal continuity and seizure duration modeling Evaluation based on seizure–prediction interval overlap, not just pointwise detection.
~80–95
~75–90
High for sustained seizures; lower for very brief events
Moderate
Table 1. The list of most popular seizure detection software by vendors and basic characteristics. Performance metrics are based on the referenced publications. Please note that developers typically do not disclose the inter-rater agreement rate of their testing data.
Deep-Dive: How to compare detection performance
Let’s assume all published studies disclose their performance metrics or make the codebase available. Is there a simple graphical representation that encompasses the most relevant performance indices and puts them in the context such that the ranking of methods becomes evident? We recommend plotting the empirical F1 curve for each model, which shows the trade-off between Recall and Precision for the given seizure detection method and enables comparison with similar algorithms. In Figure 1, we illustrate examples of the performance indices of a fictitious poor-performing and a well-performing seizure detection model. Imagine each model is tested on the same dataset by varying model sensitivity, resulting in different F1 curves (colored dashed lines). The maximum of P x R provides us with the highest F1 score for a given test. Connecting those F1 scores (colored filled circles) yields an F1 contour that lies on the landscape of theoretical F1 contours (thin green lines).
For a poor-performing model, the F1 contour lies far below the diagonal, while the F1 contour of a well-performing model lies far above the same diagonal. The graphical representation of the F2 scores was introduced in Blog #2, Figure 2. A nice feature of F1 contours is that they enable comparison of multiple seizure detection models within the same parameter space. If most seizure detection models publish their F1 scores and their testing parameters (testing dataset, quantification of ground-truth performance, and sensitivity thresholds), and those are comparable, the F1 contours of different models’ performances can be shown on the same P x R plot, making the comparison self-evident. Figure 1 below illustrates a side-by-side comparison of good and poor model performance.
Figure 1. Comparison of poor and good model performances. The X- and Y-axes represent the recall (R) and precision (P) indices, respectively, for two fictitious seizure-detection models. The thin green curves represent the theoretical F1 contours in the Recall-Precision landscape, and the dotted line is our subjective division between good and poor performances. Different models can be directly compared by overlaying their F1 curves. What distinguishes a model of good performance from a model of poor performance is the positions of their F1 curves (red for the poor-performing model and green for the good-performing model). The colored data points on the curves represent the best recall and precision results achieved by separate testing runs, with their F1 curves (dashed lines), while systematically varying parameters such as sample size, model sensitivity, and neural network architectures.
Encouraging Examples of Testing Seizure Detection Methods
A limited number of studies provide examples of rigorously conducted, real-world validation of seizure detection systems using large cohorts. One such example is the 2025 study by Sheikh et al. [7]. This retrospective observational study evaluated the performance of an automated seizure burden estimator (ASBE) integrated into a rapid-response EEG (rr-EEG) system for detecting clinically significant electrographic seizure activity, particularly electrographic status epilepticus (ESE), without requiring immediate expert interpretation. Key methodological features included a multi-center design and independent (blinded) expert review.
Methodological highlights:
The study reviewed consecutive clinical rr-EEG recordings performed at multiple hospitals between 2019 and 2021.
Each EEG was independently and blindly reviewed by three human experts.
A reference standard was defined as at least 2 of 3 reviewers agreeing on whether seizure activity was present.
The main performance metrics were the negative predictive value (NPV) and positive predictive value (PPV) of the automatic seizure burden estimator for detecting or excluding ESE at various seizure-burden thresholds (e.g., >1%, >10%, >20%, >50%, >90%).
The only caveat was that the grand truth was quantified based on a partial montage instead of a full montage EEG, which introduced a positive sensitivity bias.
Key Findings: The study concluded that a very highnegative predictive value (≈99%) at the cost of sensitivity drop. It means, it rarely misidentified seizure activity when it was absent. Interestingly, the study revealed that many seizures were missed when they were present, occasionally with sensitivity as low as 29%.
Related Considerations: These results point to two considerations: High negative predictive values are to be expected in rare clinical events such as seizures. Negative predictive values also increase with the length of EEG studies, if the seizure events are limited in duration and frequency, i.e. such as might be found after successful early administration of AEDs. To primarily focus on negative predictive values to determine the clinical viability of an algorithm may introduce a bias driven by dataset length. The value of negative predictive scores also becomes increasingly inconclusive if AED were administered at any point during the recording. Finally, the balance of sensitivity and specificity in this device depends heavily on the chosen seizure-burden threshold, underlining the interpretational nuance when deploying such tools in practice.
Clinical Implications: Rapid-response systems with automated estimators may enhance early seizure detection in acute or resource-limited settings, but should not be viewed as replacing expert EEG review. Where expert consensus (ground truth) is low or subtle, algorithm performance must be contextualized against the variability in human interpretation — as explained above. In other words, the argument seems valid that automated estimators are a helpful triaging aid but are not a full replacement for human interpretation at this time.
Final Thoughts
AI driven seizure burden assessments opened up an exciting and necessary step in the evolution of further automating and improving the diagnostic process in the epilepsy space. Much good has already and will continue to come from that, in particular for improving access to care in rural and underserved communities. The ability to quickly triage patients on the spot, to provide more appropriate downstream diagnostics and resulting treatments will continue to have a profound impact on patients’ lives. The continued task for the epilepsy community as a whole will be to set appropriate and commonly accepted standards to compare the increasing amounts of algorithms in a clinically meaningful way that benefit patients.
Assessing the current state of publicly reported AI driven seizure assessment approaches, it appears safe to say that there remains to be a gap in much anticipated clarity of results and real-life applicability. We advocate for an increased number of independent multi-center, double blinded studies, using full montage ground-truth approaches to fully understand how far AI can truly assist in the complex process of diagnosing and treating patients to achieve best outcomes. Until then, it appears safest to engage with AI driven approaches as an advanced triaging tool rather than a replacement for a time-tested physician-expert driven diagnostic process.
References:
Scheuer, M. L., Wilson, S. B., Antony, A., Ghearing, G., Urban, A., & Bagić, A. I. (2021). Seizure detection: Interreader agreement and detection algorithm assessments using a large dataset. Journal of Clinical Neurophysiology, 38(5), 439–447. https://doi.org/10.1097/WNP.0000000000000709
Zeto, Inc. (n.d.). Internal testing of Encevis AI-Powered seizure detection [Unpublished internal report].
Vespa, P. M., Olson, D. M., John, S., Hobbs, K. S., Gururangan, K., Nie, K., Desai, M. J., Markert, M., Parvizi, J., Bleck, T. P., Hirsch, L. J., & Westover, M. B. (2020). Evaluating the clinical impact of rapid response electroencephalography: The DECIDE multicenter prospective observational clinical study. Critical Care Medicine, 48(9), 1249–1257. https://doi.org/10.1097/CCM.0000000000004428
Kamousi, B., Karunakaran, S., Gururangan, K., Markert, M., Decker, B., Khankhanian, P., Mainardi, L., Quinn, J., Woo, R., & Parvizi, J. (2021). Monitoring the burden of seizures and highly epileptiform patterns in critical care with a novel machine learning method. Neurocritical Care, 34(3), 908–917. https://doi.org/10.1007/s12028-020-01120-0
Herman S. T. (2027). Hardware Technology for Point-of-Care EEG: A Comprehensive Review. Journal of clinical neurophysiology: official publication of the American Electroencephalographic Society, 43(3), 191–203. https://doi.org/10.1097/WNP.0000000000001240
Grant, A. C., Abdel-Baki, S. G., Weedon, J., Arnedo, V., Chari, G., Koziorynska, E., Lushbough, C., Maus, D., McSween, T., Mortati, K. A., Reznikov, A., & Omurtag, A. (2014). EEG interpretation reliability and interpreter confidence: a large single-center study. Epilepsy & behavior : E&B, 32, 102–107. https://doi.org/10.1016/j.yebeh.2014.01.011
Sheikh, Z. B., Dhakar, M. B., Fong, M. W. K., Fang, W., Ayub, N., Molino, J., Haider, H. A., Foreman, B., Gilmore, E., Mizrahi, M., Karakis, I., Schmitt, S. E., Osman, G., Yoo, J. Y., & Hirsch, L. J. (2025). Accuracy of a rapid-response EEG’s automated seizure-burden estimator: AccuRASE study. Neurology, 104(2), e210234. https://doi.org/10.1212/WNL.0000000000210234
Haider, H. A., Esteller, R., Hahn, C. D., Westover, M. B., Halford, J. J., Lee, J. W., Shafi, M. M., Gaspard, N., Herman, S. T., Gerard, E. E., Hirsch, L. J., Ehrenberg, J. A., LaRoche, S. M., & Critical Care EEG Monitoring Research Consortium. (2016). Sensitivity of quantitative EEG for seizure identification in the intensive care unit. Neurology, 87(9), 935–944. https://doi.org/10.1212/WNL.0000000000003034
Wilson, S. B., Scheuer, M. L., Emerson, R. G., & Gabor, A. J. (2004). Seizure detection: Evaluation of the Reveal algorithm. Clinical Neurophysiology, 115(10), 2280–2291. https://doi.org/10.1016/j.clinph.2004.05.018
Ganguly, T. M., Ellis, C. A., Tu, D., Shinohara, R. T., Davis, K. A., Litt, B., & Pathmanathan, J. (2022). Seizure detection in continuous inpatient EEG: A comparison of human vs automated review. Neurology, 98(22), e2224–e2232. https://doi.org/10.1212/WNL.0000000000200267
Trinka, E., Cock, H., Hesdorffer, D., Rossetti, A. O., Scheffer, I. E., Shinnar, S., Shorvon, S., & Lowenstein, D. H. (2015). A definition and classification of status epilepticus—Report of the ILAE Task Force on Classification of Status Epilepticus. Epilepsia, 56(10), 1515–1523. https://doi.org/10.1111/epi.13121
Fürbass, F., Ossenblok, P., Hartmann, M., Perko, H., Skupch, A. M., Lindinger, G., Elezi, L., Pataraia, E., Colon, A. J., Baumgartner, C., & Kluge, T. (2015). Prospective multi-center study of an automatic online seizure detection system for epilepsy monitoring units. Clinical Neurophysiology, 126(6), 1124–1131. https://doi.org/10.1016/j.clinph.2014.09.023
People often assume that all FDA-reviewed devices go through the same process. In reality, the U.S. Food and Drug Administration (FDA) uses multiple regulatory pathways, and the terms like FDA cleared, FDA approved, and FDA granted have specific meanings.
Understanding this distinction is important for healthcare professionals and patients, particularly in fast-moving fields such as neurology, digital health, and AI-enabled innovation.
Overview: Key Regulatory Pathways
At a high level, FDA clearance applies to most low-to-moderate-risk medical devices, while FDA approval applies to high-risk medical devices. A third pathway is De Novo, where the FDA “grants” a new device type for certain novel low-to-moderate risk devices with no predicate. These pathways differ significantly in risk classification, evidence requirements, review timelines, and cost. As a quick takeaway:
FDA Cleared (510(k)): FDA determined the device is substantially equivalent to a legally marketed “predicate” device for its intended use.
FDA Granted (De Novo): FDA classified a novel low-to-moderate risk device type when there is no suitable predicate.
FDA Approved (PMA): FDA reviewed evidence intended to demonstrate a reasonable assurance of safety and effectiveness for many high-risk (Class III) devices.
Exempt: Most low-risk (Class I) and some Class II devices do not require premarket review and can go directly to market, though they are subject to other controls.
People often say “FDA approved” as shorthand, but for many medical devices the more precise terms are cleared (510(k)) or granted (De Novo).
What Is FDA Approval?
FDA approval refers to the Premarket Approval (PMA) process, which is the FDA’s scientific and regulatory review to evaluate whether there is a reasonable assurance of safety and effectiveness for most Class III (highest-risk) devices.
This process requires manufacturers to provide independent scientific evidence, usually from extensive clinical trials, demonstrating a reasonable assurance that the device is safe and effective for its intended use.
Applies to life-sustaining or life-supporting devices
Requires extensive clinical trials
Involves a detailed review of safety and effectiveness
Has longer timelines and significantly higher costs
Often includes post-market study requirements
Examples of FDA-Approved Devices
Implantable deep brain stimulation (DBS) systems
Implantable neurostimulators used for epilepsy management and other neurological conditions
Implantable continuous brain monitoring devices, such as long-term intracranial EEG systems used to detect and track seizure activity
These devices are typically implantable, life-sustaining, or life-altering, which places them in the FDA’s Class III (high-risk) category, requiring full FDA approval rather than clearance.
Example: A new implantable deep brain stimulation device for Parkinson’s disease must complete multi-year clinical trials and receive FDA approval via the PMA pathway before being marketed.
What Is FDA Clearance?
FDA clearance means a medical device has been reviewed through the 510(k) premarket notification process and found by the FDA to be substantially equivalent to an already legally marketed device. Such comparator devices are called predicate devices.
The FDA does not independently determine safety and effectiveness from scratch. Instead, it evaluates whether the new device is at least as safe and effective as an existing device already on the market.
Applies primarily to Class II (moderate-risk) devices
Requires comparison to a predicate device
Typically relies on bench testing, software validation, and performance data
Clinical trials are often not required
Is faster and less expensive than FDA approval
Examples of FDA-Cleared Devices
Common FDA-cleared devices in the EEG and brain-monitoring industry include:
Non-implantable EEG acquisition systems used in clinical, ambulatory, and point-of-care settings
EEG analysis and visualization software, including cloud-based and AI-assisted interpretation tools
EMG and evoked potential (EP) systems used for neurological diagnostics
Neurophysiological patient monitoring systems for seizure detection and brain-state monitoring
Wearable and portable brain-monitoring devices designed for remote, home, or outpatient use
These devices are typically classified as moderate-risk (Class II) and are cleared through the 510(k) pathway by demonstrating substantial equivalence to existing EEG and neurodiagnostic technologies already on the market.
Example: A company develops a new EEG monitoring system that uses established signal-acquisition technology and has the same clinical indications as an existing EEG device. If it can demonstrate substantial equivalence to the existing device, it may receive FDA clearance through the 510(k) pathway.
What Is FDA “Granted” (De Novo)?
If there is no appropriate predicate device, a company may pursue the De Novo pathway for certain novel low-to-moderate risk devices. If granted, the FDA establishes a new device type, classifies it as Class I or Class II, and establishes any special controls required for Class II devices. Future devices of the same type can then use the 510(k) pathway.
Key Differences at a Glance
Aspect
FDA Clearance
FDA Granted
FDA Approval
Regulatory Pathway
510(k) Premarket Notification
De Novo
PMA
Risk Level
Moderate (Class II)
Low to Moderate (Class I & II)
High (Class III)
Predicate Device
Required
No
No
Clinical Trials
Often not required
Often Required
Required
Review Time
Months
Months
Years
Common Misconceptions
“FDA cleared” does not mean “FDA approved.” These terms are not interchangeable, but both indicate the medical device can be legally marketed in the United States. Whether FDA cleared or approved, these devices’ manufacturers remain subject to quality system regulations, labeling requirements, post-market surveillance, and adverse event reporting.
An “FDA approved” label doesn’t inherently mean a device is better than an “FDA cleared” one. Those terms reflect FDA-defined regulatory pathways that are determined by a device’s risk classification, how well it fits within existing device types, and whether there’s an appropriate predicate, not a manufacturer’s preference for one label over another.
For many moderate-risk devices, the 510(k) pathway is available when a manufacturer can demonstrate the new device is substantially equivalent to a legally marketed predicate. In this pathway, the demonstration of substantial equivalence serves as a proxy for a direct demonstration of reasonable assurance of safety and effectiveness.
For example, an EEG system that can leverage a well-established, “gold standard” predicate may reach the market via 510(k) by demonstrating substantial equivalence to that predicate’s performance and intended use.
For PMA devices, showing similarity to a predicate is not considered sufficient evidence because the PMA standard is affirmative: the manufacturer must provide valid scientific evidence demonstrating a reasonable assurance that the device is safe and effective for its own specific intended use.
In higher-risk contexts, the FDA generally does not rely on substantial equivalence as a proxy for safety and effectiveness. Small differences in design, materials, software, human factors, or clinical workflow can meaningfully change the risk profile and clinical performance, and the consequences of unexpected failure are higher. As a result, the FDA typically requires direct evidence (bench, animal when relevant, and often clinical data) that addresses the device’s specific risks and demonstrates that the benefits outweigh those risks for the intended population and use.
Bottom line: ‘cleared’ versus ‘approved’ is about which regulatory route applies given FDA definitions and risk-based requirements. It is important to note that the fundamental legal standard for all pathways is to provide a reasonable assurance of safety and effectiveness; the pathway simply defines the method used to demonstrate it. The meaningful comparisons between devices come from their indications for use, claims, and supporting evidence, not from the cleared/approved label alone.
Final Thoughts
FDA clearance and FDA approval serve different but equally important roles in ensuring medical device safety in the United States. Clearance focuses on equivalence and performance for moderate-risk devices, while approval requires direct proof of safety and effectiveness for high-risk technologies.
For many innovations in neurology and digital health-especially those based on EEG technology-FDA clearance through the 510(k) pathway is the appropriate and established regulatory process, not a shortcut.
Disclaimer: This article is for informational purposes only and does not constitute legal or regulatory advice. The information provided is a general overview of FDA regulatory pathways and should not be relied upon as a substitute for consulting with a qualified regulatory professional. The FDA’s regulations and guidance are subject to change.
How one ICU nurse leader brought rapid EEG to her community hospital – and why it’s keeping more patients near home.
This is a transcription from the Rapid Response RN podcast episode featuring Kristen Marin, RN, Director of Critical Care and Trauma Services at a community hospital in Northern California. The episode explores how rural ICUs can expand care capabilities and keep patients close to home.
Podcast Episode:Rapid Response RN – Caring Close to Home 🎧 Listen to the full episode:LINK
For rural families, a hospital transfer isn’t just a change in care level – it can mean separation, long drives, financial hardship, and missed time with loved ones during critical moments. These are the challenges Kristen Marin has spent nearly 20 years addressing.
A Rural Nurse with a Mission
Kristen has spent her career at the same community hospital, working in Med-Surg, Emergency and Trauma, and now ICU leadership. Her focus has always been on rural healthcare. “I’m a self-proclaimed rural nursing champion,” she says. “I’m drawn to caring for the people in my community.” Her goal has been to expand services that reduce unnecessary transfers – one of the biggest challenges in rural care.
The Reality of Rural Critical Care
In rural settings, transfers are often dictated not just by patient needs but by limited local resources, distance, and weather. The nearest tertiary center may be hours away, EMS availability can be unpredictable, and receiving hospitals are often full.
Before introducing EEG services, the hospital routinely transferred patients with:
unexplained altered mental status
suspected or possible seizures
unclear neurological symptoms
Not because they necessarily required a higher level of care, but because clinicians had no way to confirm what was happening.
Expanding ICU Capabilities
When the team explored diagnostic tools to expand their ICU capabilities, point-of-care EEG emerged as a practical solution. Because rural hospitals rarely have neurodiagnostic technologists, Kristen’s team developed a new workflow:
Provider orders spot EEG
Trained RN or RT places the headset
Device captures a 30–60 minute recording
Data is sent to remote neurologists
Team receives rapid interpretation and care guidance
“It’s empowering,” Kristen says. “Our staff saw it as professional development. Who knew you could work in a rural hospital and be doing EEGs?”
This approach allowed the hospital to make informed decisions about which patients truly require transfer.
The Result: Fewer Transfers, Faster Answers, Stronger Community Care
“We are keeping these patients local,” Kristen emphasizes.
With rapid EEG, the team can quickly determine whether a patient is seizing, experiencing metabolic encephalopathy, or presenting with non-epileptic symptoms. Families stay involved, patients stay near home, and clinicians make decisions based on data rather than uncertainty.
“I see families at the bedside while we’re doing the EEG, and I can explain what we’re doing and why,” Kristen says. “It’s meaningful. I wish we’d done this sooner.”
Advice to Nurse Leaders: Be the Catalyst
Kristen encourages other rural nurse leaders to:
Align with your hospital’s mission to prioritize patient-centered care
Collaborate closely with physicians to ensure successful implementation
Select technology that supports and empowers staff
Advocate boldly to drive meaningful change
One Year Later: A More Capable Rural ICU
The hospital now receives requests from outpatient physicians for EEG services – an unexpected but welcome evolution. “It’s been good for our patients, for our staff, for our hospital,” Kristen says. “I’m so happy we took the jump.”
In this presentation from the American Heart Association’s Scientific Sessions, Joe Daniel Schorre, Director of Cardiopulmonary and Emergency Management at Huntsville Memorial Hospital in East Texas, shares how his team solved a major care gap: the complete absence of EEG services in their rural community.
With no neurologists on staff, no EEG techs, and no ability to perform EEG onsite, the hospital had been forced to transfer nearly half of its neuro-related patients – about 10 patients each month – solely because EEG was unavailable. Joe explains how implementing the Zeto rapid EEG system enabled faster diagnosis, reduced transfers, retained critical hospital revenue, and kept patients closer to home and family support.
For a deeper look at Huntsville Memorial Hospital’s journey, you can also read the full case study with Joe Schorre here: View detailed case study → LINK.
Below is the transcript of his talk.
Huntsville Memorial Hospital, a rural facility in East Texas about 60 miles north of major academic medical centers, was founded in 1927. It is a 123-bed acute care hospital serving a diverse population that includes families with limited incomes, a high local poverty rate, seven state prisons, and a large university community. The hospital’s mission is to care for the community with compassion, integrity, and excellence.
A 24-month review of emergency transfers revealed a clear problem: the hospital was sending out every patient who required EEG services. These transfers often meant more than an hour of travel, delayed diagnosis and treatment, lost hospital revenue, and significant financial and emotional burdens on families. The average out-of-pocket cost for a transfer was around $200, not including lost wages or the stress placed on patients and caregivers. For many in the community, this was simply unsustainable.
The team needed an EEG solution that fit into the existing workflow, required minimal capital investment, and didn’t rely on specialized EEG personnel. After evaluating available technologies, they selected the Zeto rapid EEG system, which integrates easily into the respiratory care workflow and allows remote epileptologists to review studies live when necessary and complete final interpretations afterward.
Within three months, the hospital moved from device selection to full implementation, going live on December 16, 2024. In the first six months, the program enabled the hospital to retain 44 admissions that otherwise would have been transferred. This kept patients close to home, preserved essential hospital revenue, and reduced the financial and emotional strain associated with transfers.
Keeping patients local improves continuity of care, supports faster diagnosis and treatment, and allows families to remain involved at the bedside. It also strengthens trust between Huntsville Memorial Hospital and the community it serves.
This program has been transformative for the facility and is something many rural hospitals may want to consider. It reduces unnecessary transfers, increases admissions that would otherwise be lost, and elevates the level of care delivered locally. Huntsville Memorial Hospital is proud to share the impact of this initiative and the role Zeto EEG has played in supporting rural healthcare.
Many small hospitals face similar challenges: no EEG services, no neurologists to interpret studies, and no EEG technicians. The hospital’s review showed that nearly half of its neuro-related transfers—about 10 patients per month—were due solely to the absence of EEG. Implementing rapid EEG directly addressed this gap and brought essential neurodiagnostic capabilities to the community.
Bring rapid EEG to your rural hospital
If your facility faces high transfer rates, limited access to neurologists, or challenges delivering neurodiagnostic services, Zeto can help you.