
Filters are commonly used during clinical assessment of EEG brainwaves. They are recommended in the ACNS guidelines¹ to reduce electrical noise and improve EEG data quality. The basics of filter theory are part of the training curriculum for physicians and EEG techs² alike, yet the impact of filters on interpreting data is not always apparent to everyone in the day to day clinical operations. This blog summarizes the issues, explains what filters exist, and what effects they can have on the morphology of the EEG waveforms. Selecting the right filter settings can help improve readability and reduce misinterpretations.
Why We Filter and Why It’s Appropriate
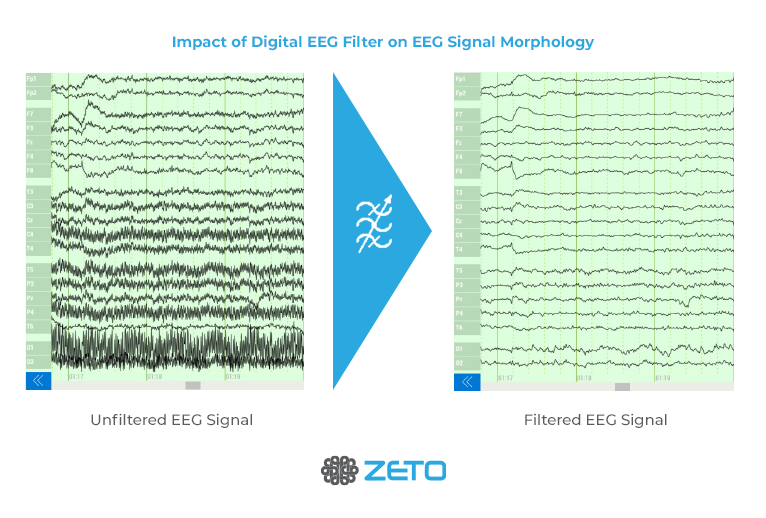
A considerable amount of raw data in EEGs are contaminated by noise and artifacts. This noise originates from various sources such as the environment, recording instruments, or from within the body that are not of interest to analyzing the EEG (i.e. “physiological noise”). The problem arises when these noise sources mask the target EEG signal or interfere with its assessment. Oftentimes, however, the artifact noise and target EEG signal occupy different spectral regions, and selectively filtering out specific frequencies may improve the overall signal-to-noise ratio (SNR).
For example, a direct current (DC) or baseline offset of the amplifier system or slow fluctuations induced by sweat artifacts may be removed with a high-pass filter. Electrical power line noise in the recording environment can be attenuated by using a notch filter at 50 or 60 Hz. And, unwanted high-frequency components from muscle artifacts can be removed by “smoothing” the data with a low-pass filter. The advantages of filters are that they can help increase the SNR of target signals especially in situations in which the target EEG signals are in a limited band.
Filters are applied selectively to exclude frequencies from further evaluation. Three main types of filters used to accomplish this for EEG are i) high-pass filters (also called low-cut-off filters), ii) low-pass filter (also called high-cut-off filters), or iii) band-reject filters (or also called notch filters) – See Figure 1. Most EEGs evaluated in clinical day to day operations have a combination of these filter types applied before a reviewer assess clinical characteristics for triaging or diagnosis.³
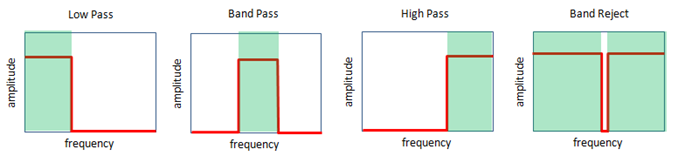
Figure 1: A Low pass filter is a filter that passes low frequency components and blocks high frequency signals. A High pass filter is a filter that passes high frequency signals and blocks low frequency signals. Bandpass filter is a filter that passes a certain range of frequencies and blocks both lower and higher regions. A Band Reject filter is a filter that passes most of the frequency except a very narrow range of the frequencies.³
Because of their useful properties, filters are found at all stages during the EEG recording and review process. EEG amplifiers often contain an analog low-pass filter ahead of the analog-to-digital (AD) converter to address aliasing artifacts that are otherwise introduced due to the discrete sampling rate. However, most filters in EEG processing are digital and take place after the AD conversion. That makes filters omnipresent when working with EEG data and their settings will affect the look and shape of the EEG tracings on a reader’s screen. More in-depth analysis of filter times and filter theory.⁴
Wanted and Unwanted Effects of Filters on EEG Morphology
The way that many filters operate is to apply a weighted average of consecutive data points of the raw signal to obtain a smoothed, output (filtered) waveform. Depending on the type and width of this averaging window, specific frequency components disappear from the output waveform. The filtered signal may not show excluded frequencies anymore, but this was made possible after having created a causal relationship with the surrounding data segments. Figure 2 illustrates this principle.
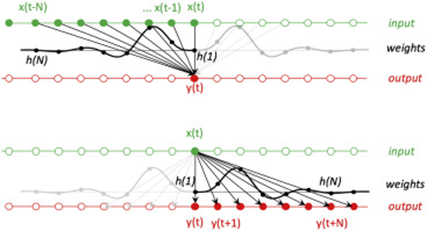
Figure 2. Every sample of the output depends on multiple samples of the input, as illustrated in Figure 2 (top). Conversely, each sample of the input impacts several samples of the output (Figure 2, bottom). As a result, the signal that is being filtered is smeared along the temporal axis, and temporal relations between filtered and original waveforms are blurred.
Top: each sample of the output y is the sum of samples of the input x weighted by the impulse response h. For a causal filter, only past or present samples of the input make a contribution (black). For an acausal filter, future samples too can contribute (gray). Bottom: another way of describing this process is that each sample of the input x affects multiple samples of the output y, with a weight determined by the impulse response h.⁴
Filters that lead to this kind of temporal smearing are called causal filters and are frequently used in EEG assessments. However, causal filters are known to create ripples in the EEG data that will show up as slow waves in the EEG data. These causal filters create a phase shift but have the advantage that they can be applied in real-time to ongoing EEG data streams.
To avoid phase shifts and to get outputs much closer to the true biological signal, so-called forward/backward filters (or zero phase) filters are another option. Zero phase shift filters first run the filter in one direction and again in the other direction. As a result, any phase shift is mitigated and no temporal smearing occurs. However, the disadvantage of these zero-phase filters is that they can only be applied in real-time recordings with a significant delay because they have to wait for data to be recorded before they can run backwards.
Figure 3 illustrates the output of a causal (blue) or zero phase filter (green) when applied to a test signal (black). The output of the causal filter (blue) creates a well visible phase shift and relevant filter ripple along with a long overshoot. In contrast, the zero phase shift filter keeps the integrity of the main signal peak intact and only creates minor symmetrical ripples around the peak.
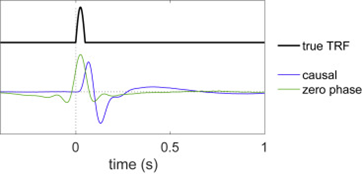
Figure 3. Temporal Response Function Estimated from Simulated Stimulus-Response Data. Black: “true” TRF. Thick blue: TRF estimated using response data that has been filtered by a causal filter (Butterworth band pass 1–10 Hz, order 4+4). Green: same with acausal filter (MATLAB’s filtfilt).⁴
Examples of Causal and Zero Phase Filters in EEG
The most noticeable difference between causal and zero phase shift filters on actual EEG data occurs for high pass filters in the delta range (<1.5Hz) because they can visibly alter the appearance of commonly occurring biological signal components of the EEG such as vertical or horizontal eye movements (i.e., blinks and saccades), sweat artifacts, and even specific epileptiform discharges (e.g. absence seizures). For an overview, see Figure 4.
Effects of causal filters in higher frequencies (>50Hz) certainly exist as well but these are much less noticeable due to much faster oscillations that have smaller amplitude and are harder to pick out visually.
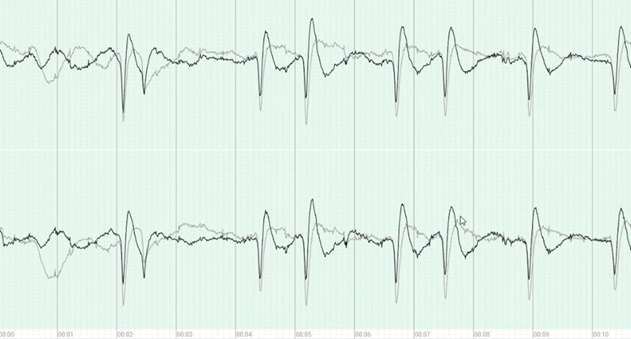
Figure 4 – Here an example of two channels (FP1, FP2) filtered with a 1Hz causal filter (black tracings) or zero-phase filter (gray tracings) – causal filters introduce relevant slow wave filter ripples.
Implementation of Causal and Zero Phase Filters on the Zeto Cloud Platform
Most clinical EEG hardware or software manufacturers have filter master-settings that pre-determine the exact type and properties of the filters available in their products. That can result in situations in which the same biological signal may appear slightly differently depending on the manufacturer’s default digital filter settings. Zeto is improving the tradition by introducing features that enable users to easily switch between different filter types and settings to optimally control the use of filters while reviewing EEG data.
As a result, users can configure their filter preferences to match their individual viewing and training history, resulting in filter outputs that match their expectations. Instead of retraining themselves on a new system’s filter settings, they can now adjust filter attributes and reduce the time to a confident read significantly.
With Zeto, EEG data is saved in raw unfiltered (DC) formats that do not distort the original signal attributes. Subsequent digital filtering can then be used to match desired filter attributes. For example, Zeto can display data after running causal or zero phase shift filters and switch between these filter settings more easily, making it possible to compare which setting is preferred on the spot.
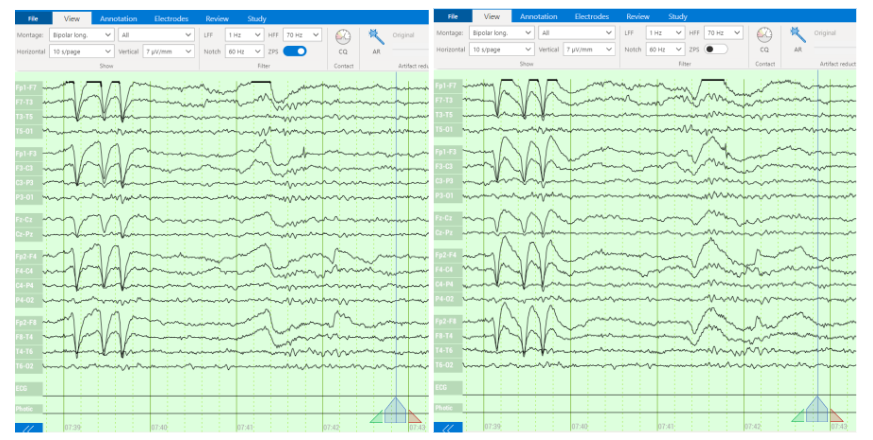
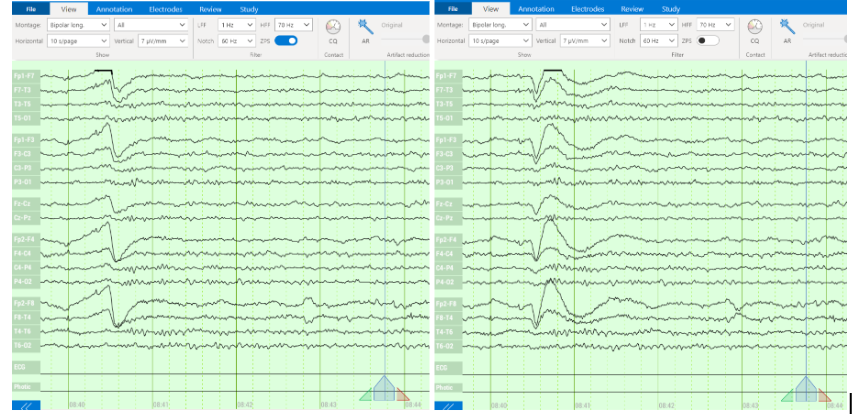
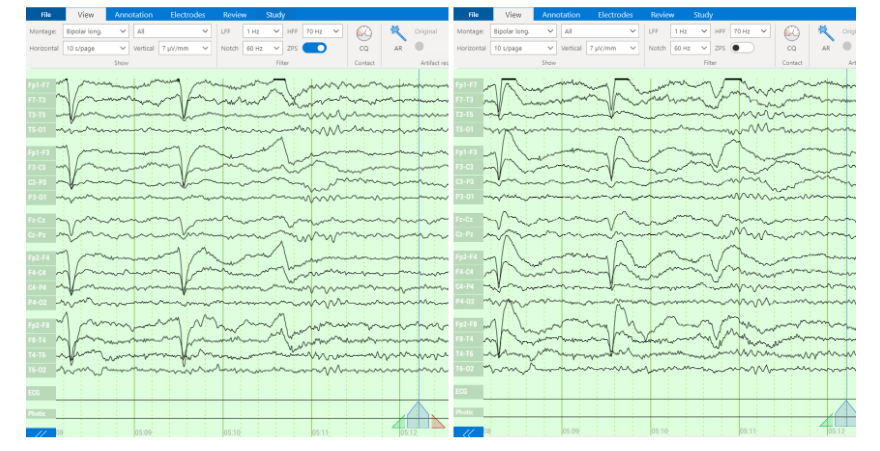
Figure 5 illustrates this filter switch approach on different data samples. The tiles on the left are filtered using zero phase filters and tiles on the right show the same data using causal filters of the same cut-off frequency. Switching between these filters reveals signal ripples, most noticeable for the blinks but also in other signal components.
1Hz Filter – left: zero phase; right: causal filters.
The benefits that filters provide are crucial to enable a confident clinical read that is not skewed by unwanted signals. However, filters can introduce artifacts on their own. The well trained EEG reader will need to be vigilant about possible filter artifacts in EEG signals and how these may affect the clinical assessment of the patient’s brain states. As Zeto, we encourage our users to match the available filter settings to their preferences to ensure a fast and efficient diagnostic process. For questions about how to best match your Zeto filter settings and establish adequate default settings, please contact our customer success team at support@zetoinc.com.
References:
- Sinha, S. R., Sullivan, L., Sabau, D., et al. (2016). American Clinical Neurophysiology Society Guideline 1: Minimum Technical Requirements for Performing Clinical Electroencephalography. Journal of Clinical Neurophysiology, 33(4), 303-307. DOI: 10.1097/WNP.0000000000000308
- ASET Board of Trustees. (2021, March 20). National competency skill standards for performing electroencephalography (EEG). ASET Website. Retrieved from https://www.aset.org/wp-content/uploads/2022/11/EEG_Competencies_FINAL.pdf (Page 4, Section 2.3)
- ShareTechnote. (n.d.). RF – Filter. Retrieved from https://sharetechnote.com/html/RF_Filter.bak
- De Cheveigné, A., Nelken, I. (2019). Filters: When, Why, and How (Not) to Use Them. Neuron. DOI: 10.1016/j.neuron.2019.02.039